Everyone in marketing is talking about AI visibility right now. Every agency deck, every conference keynote, every LinkedIn post is telling you to "optimize for AI." Build topical authority. Get mentioned on Reddit. Create entity-rich content. Earn citations in LLM responses.
The advice sounds reasonable, but the problem is that not all of it is grounded in data.
I set out to answer a simple question:
Across real competitive landscapes in four different industries, which measurable digital signals actually correlate with higher ChatGPT visibility? Not theoretically. Not anecdotally. Statistically.
I pulled 37 metrics for 62 brands spanning travel, cinema, B2B payments, and databases. Ran Pearson and Spearman correlations against two distinct ChatGPT visibility measures. And corrected for multiple comparisons so we wouldn't fool ourselves.
The findings challenge some popular assumptions:
- Paid search spend? No relationship.
- TikTok presence? Nothing.
- SERP features? Zero signal.
But a handful of authority-weighted metrics showed up consistently showing what LLMs may actually value.
The point is not to “game ChatGPT” or find the latest “hack.” I wanted to know: What does the data tell marketers to do to build real brand impact in LLM visibility?
The Methodology
We analyzed two dimensions of ChatGPT visibility, sourced from Scrunch AI:
● Citation Visibility (Responses): The raw number of ChatGPT responses in which a brand was cited or linked. This measures how often a brand shows up as a source.
● Mention Visibility (Presence %): The percentage of relevant ChatGPT answers in which the brand was mentioned by name. This measures how top-of-mind a brand is in AI-generated answers.
Against those two targets, we tested 37 predictor metrics per competitive set, sourced from DataForSEO's Backlinks, SERP, Labs, and Keywords Data APIs. These span seven categories:
| Category | Metrics Included |
|---|---|
| Backlinks | Referring domains, total backlinks, DA 60+ backlinks, news site backlinks, industry pub backlinks, Reddit backlinks, mentions in "best" articles |
| Indexation & Site Scale | Indexed pages, total internal links, total external links, subdomain count, indexed images |
| Social & Community Mentions | LinkedIn, Quora, Reddit, TikTok, Wikipedia, GitHub, X (Twitter), news sites, industry pubs, press releases |
| Domain Authority & SEO | Authority score, estimated organic traffic, Google/Bing organic keywords, SERP features |
| Brand Strength | Brand monthly search volume (MSV) |
| Organic Rankings | Google page 1 keywords, newly ranked, ranking up, ranking down, lost keywords |
| Paid Search | Paid keywords, paid estimated traffic value, paid traffic cost |
The Four Competitive Landscapes
| INDUSTRY | COMPETITORS ANALYZED | SAMPLE SIZE NOTE |
|---|---|---|
| Travel & Flights | 10 brands (major flight comparison and booking platforms) | Clean data, no missing values |
| Entertainment & Cinema | 17 brands (theater chains, ticketing platforms, review aggregators) |
Two outliers in target variables |
| B2B SaaS / FinTech | 15 brands (accounts receivable and payment automation vendors) | 1 missing Response, 2 missing Presence values |
| Technology / Databases | 20 brands (relational, NoSQL, cloud, and graph database providers) | Largest sample; most robust results |
Web Data is Lopsided, so Statistics Matter More
A handful of brands dominate every metric while the rest sit near zero. That makes traditional correlation methods (Pearson) unreliable because one massive outlier can distort the entire result. So we used Spearman rank correlation as our primary method. Instead of comparing raw numbers, Spearman compares rankings: do brands that rank higher on a given metric also rank higher in ChatGPT visibility? We report Pearson results alongside Spearman for transparency.
With 37 metrics, 2 visibility measures, and 4 industries, we ran roughly 350 individual statistical tests. At that volume, some results will look significant purely by chance. To filter those out, we applied Benjamini-Hochberg FDR correction. Only results that survived that filter are reported as confirmed findings. For effect sizes: anything above 0.5 is a strong correlation, 0.3 to 0.5 is moderate, and below 0.3 is weak.
The 5 Metrics That Survived 350 Tests
Out of approximately 350 correlation tests, only 21 survived FDR correction. Out of those, just 5 metrics proved significant in more than one industry.
Out of 350 tests, only 5 metrics actually held up. There is a relationship between these metrics and ChatGPT visibility, but it's a much smaller list than most people would expect. Most of what marketers assume drives AI visibility either doesn't show up in the data or only shows up in one vertical.
What Actually Held Up After We Stress-Tested the Data
Notice what's at the top of the list? Domain Authority Score.
Not raw backlinks or total content volume. The single strongest cross-industry predictor is a reputation signal, one that synthesizes link quality, link diversity, and overall site trust.
The next four metrics reinforce the same theme.
- Backlinks from DA 60+ sites (quality over quantity)
- Mentions in "best of" articles (editorial curation, not self-promotion)
- Total backlinks and referring domains round out the list, but they had the weakest relationship of the five:Having a lot of backlinks matters less than having the right ones.
The hierarchy is clear: Authority > Quality Links > Editorial Presence > Raw Volume.
This aligns with a hypothesis that's been circulating in the SEO community: that LLMs may inherit quality signals from the web ecosystem they're trained on. If high-authority sites are crawled more frequently and weighted more heavily in training data, then brands that earn links from those sites would naturally surface more often in AI-generated answers.
Your Industry Changes Your Next Move
Here's what prevents this from being a simple "do these 5 things" study: no single metric reached statistical significance across three or more industries. The universal signals above held for Travel and Technology. For Cinema and B2B SaaS, the picture looks completely different.
Travel & Flights
N = 10 competitors | Industry: consumer travel comparison
The travel competitive set produced the clearest signal in the study. Backlink metrics dominate: referring domains (r = 0.851), total backlinks (r = 0.845), mentions in "best" articles (r = 0.821), DA 60+ backlinks (r = 0.802), and indexed pages (r = 0.772) all correlate strongly with Citation Visibility.
Authority score was the single strongest predictor of both Responses (r = 0.894) and Presence (r = 0.687). Total external links (r = 0.819 Pearson, r = 0.632 Spearman) was uniquely strong here, suggesting that outbound linking behavior. How much a site connects to the broader web may matter in this vertical.
What's unique to Travel:
- Total external links predicts both Responses and Presence, not seen elsewhere
- News site mentions correlate with Responses via Pearson (r = 0.732), press coverage matters in a consumer comparison vertical
- Brand search volume (r = 0.713 Spearman) tracks Responses, consumer search demand maps to AI visibility here
Technology / Databases
N = 20 competitors | Industry: enterprise database technology
The technology set had the most brands in it (20), which gave us the most data to work with. It also produced the most confirmed results: 14 metrics held up after we stress-tested the data. Unlike other industries where only a few things correlated, tech showed a relationship across the board: backlinks, indexation, organic rankings, internal link structure, and even paid keywords.
That makes sense when you think about the tech space. There's a massive amount of documentation, Stack Overflow threads, GitHub repos, and comparison sites out there. LLMs have a lot more content to pull from in this industry than most others.
What's unique to Technology:
- Backlinks from news sites (r = 0.730, the strongest single FDR-confirmed Spearman result in the entire study)
- Total internal links (r = 0.611). Site architecture correlates with visibility here
- Paid keywords (r = 0.664 Pearson). The only industry where paid search showed any signal at all, possibly because tech companies that invest in paid also invest heavily in content
- Brand search volume showed the strongest Pearson correlation in the dataset (r = 0.771, p = 0.0001). in tech, the biggest names dominate AI answers
Entertainment & Cinema
N = 17 competitors | Industry: movie theaters and ticketing
The cinema set is where things got messy. Almost nothing correlated with either visibility measure. The two methods we used actually disagreed on whether relationships were positive or negative, which is a red flag that outliers are throwing off the results.
The problem is the competitive set itself. You've got review aggregators with 689 million backlinks sitting next to small regional theater chains with 9,500. When the gap between the biggest and smallest brands is that extreme, it's nearly impossible to find meaningful patterns. The anchor brand also had 306 responses, while the median competitor had just 14.
What's unique to Cinema:
Brand search volume is the one strong Pearson signal (r = 0.649, p = 0.005). but Spearman disagrees (r = 0.240), meaning it's driven by the biggest names, not a consistent rank-order pattern
LinkedIn mentions showed strong Spearman correlation (r = 0.663). possibly reflecting corporate/professional recognition in this space
The takeaway: When your competitive set includes both a massive review aggregator and a local five-screen theater, traditional digital metrics can't differentiate. ChatGPT's visibility in entertainment likely tracks cultural presence and brand recognition more than SEO fundamentals.
B2B SaaS / FinTech
N = 14 effective competitors | Industry: accounts receivable / payment automation
The B2B payments set's results are the most surprising in the study. Where other industries show positive correlations between web presence and AI visibility, B2B shows the opposite for several metrics:
| Metric | Spearman r | p-value | Direction |
|---|---|---|---|
| TikTok Mentions | -0.675 | 0.008 | Negative |
| Wikipedia Mentions | -0.631 | 0.016 | Negative |
| News Site Mentions | -0.538 | 0.047 | Negative |
How do we interpret negative correlations? In the B2B payments space, the brands with the most consumer web presence are general-purpose platforms that also compete in adjacent markets. The brands with the highest ChatGPT Response counts are specialists. niche players whose entire identity revolves around accounts receivable automation.
ChatGPT appears to surface specialists when asked specialized questions. In B2B, being narrowly and deeply associated with a specific problem space may matter more than having a massive web footprint.
What's unique to B2B:
- Industry publication mentions correlate with Presence (r = 0.594 Spearman). Trade press coverage is the one positive signal
- Broad consumer web signals (TikTok, Wikipedia, news) are negatively correlated. breadth may actually dilute B2B niche visibility
- No backlink metric reaches significance in either direction. The entire backlink-authority framework breaks down here
What Doesn’t Really Work
The non-findings in this study are just as important as the findings. These are the things that marketers might intuitively expect to matter but, based on this data, don't appear to.
- Paid Search: Spending on Google Ads shows zero correlation with LLM visibility across all industries tested.
- SERP Features: Winning featured snippets or knowledge panels in traditional search does not translate to ChatGPT presence.
- TikTok Mentions: Social signals from walled gardens like TikTok appear unreachable by current LLM training data.
- Indexed Images: Image volume is not a differentiator and does not help brands stand out in competitive AI landscapes.
None of this is saying stop investing in paid search or ignore TikTok. These channels serve real purposes. Paid search can boost brand awareness, which can lift brand search volume and authority, and those did correlate with visibility. But on their own, none of these metrics had a direct relationship with how often a brand shows up in ChatGPT. So if AI visibility is the goal, these aren't where you place your bets
We ran both Pearson and Spearman on all 352 metric pairs. They disagreed half the time, which is why we use Spearman as the primary method: web data is too skewed for Pearson to be reliable.
Everyone is “Investing in Brand” – Yes, and Here is Where the Data Says to Spend
When you step back and look at all of this together, a bigger picture starts to form and here’s what it’s telling you.
Authority Beats Volume
The strongest universal predictor is the domain authority score, a composite signal that reflects a site's overall trust, link quality, and web reputation. Raw backlink count is weaker. Indexed page count is weaker still. The consistent message: it's not how much you have, it's how much the web trusts you.
Reputation Beats Repetition
Getting mentioned in editorial "best of" articles correlates more strongly than having millions of social media mentions. Being linked by DA 60+ sites matters more than being linked by thousands of low-quality directories.
This has real implications for content strategy. Scaling low-quality, predictable content to accumulate volume doesn't show up in AI visibility. Earning placement in curated, high-authority editorial content does.
The Elephant in the Data
There is an elephant in the room: brand size. Large, well-known, well-regarded brands naturally have more backlinks, higher domain authority, more indexed pages, more search volume, AND more ChatGPT visibility. Every correlation in this study may be measuring the same latent variable: how big and well-known is this brand?
That's not a flaw, it may be the most important finding. If ChatGPT visibility is fundamentally a function of brand equity rather than any specific technical signal, then the path to AI visibility isn't through SEO tactics. It's through brand building.
When Citations Aren't on the Table
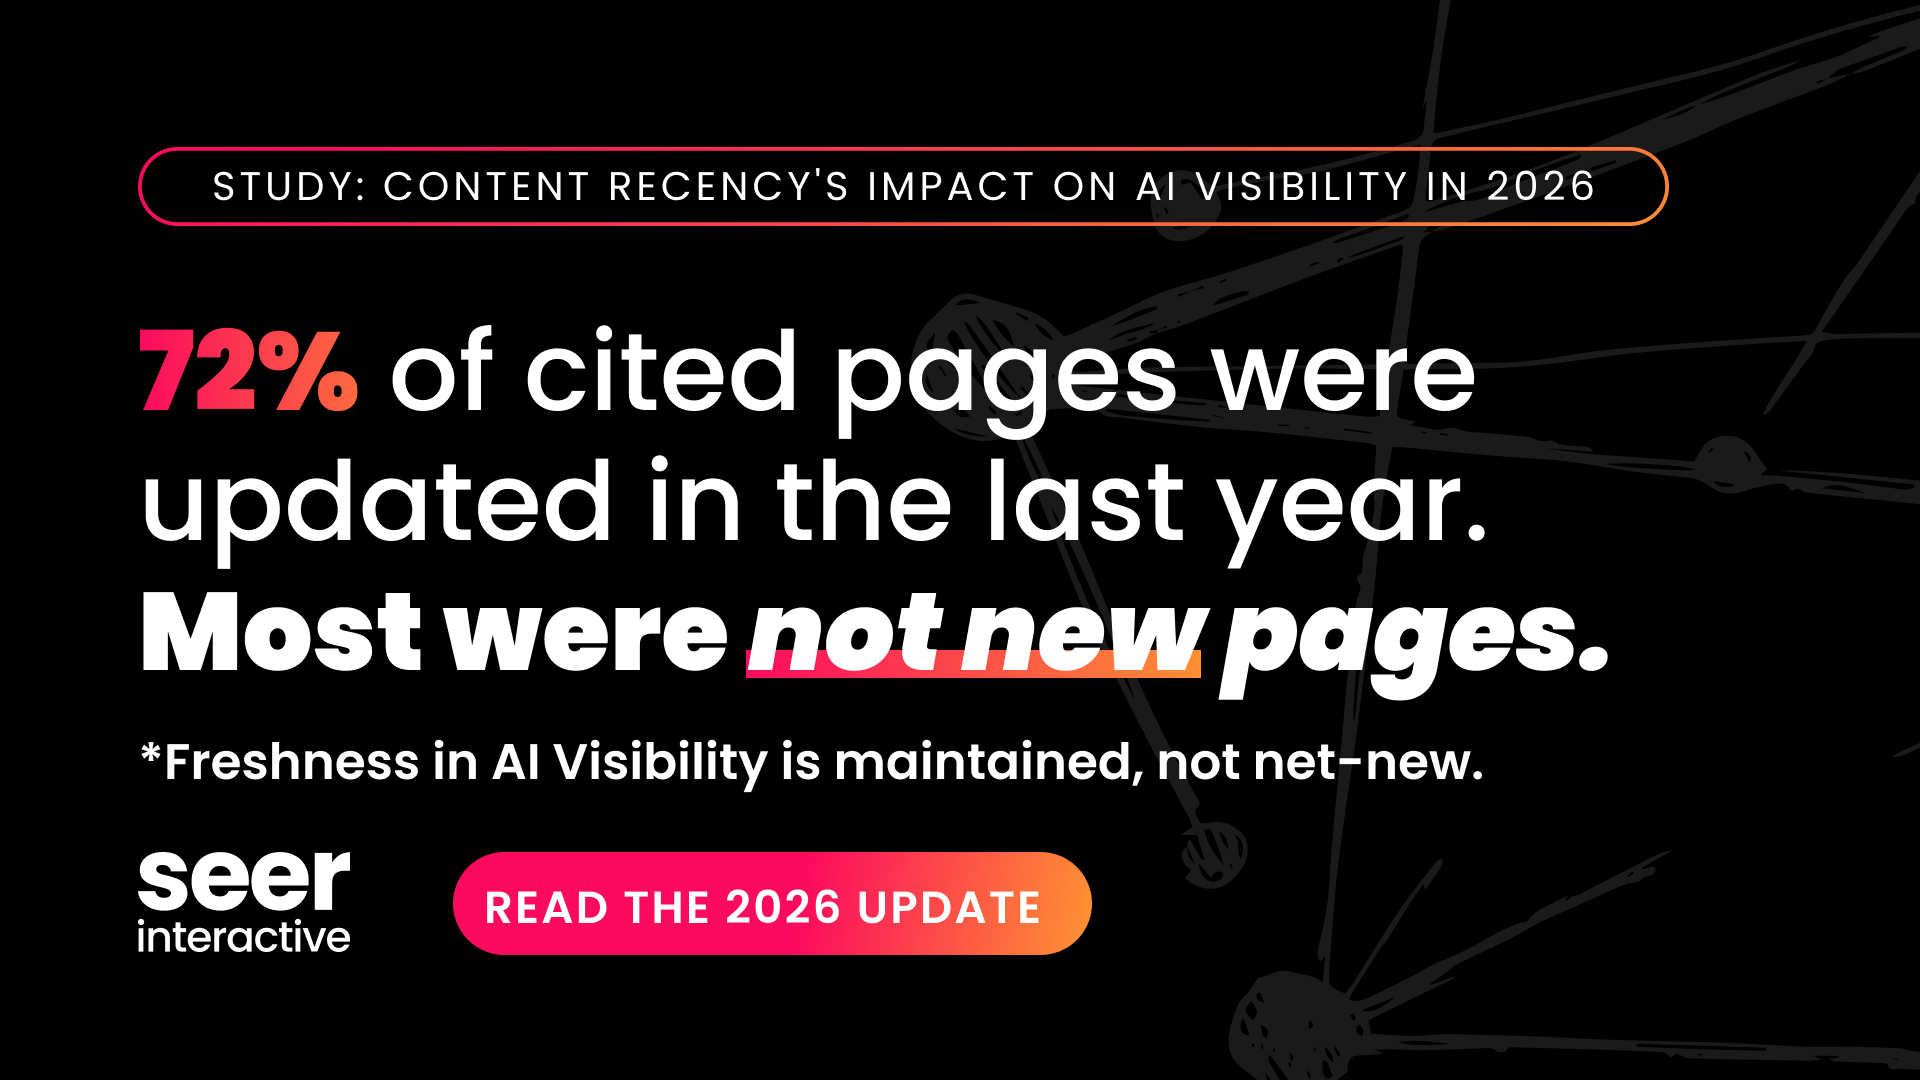
Citations are only half of the visibility picture. Across 1,046 prompts and over 27,000 responses, ChatGPT cited sources about 98% of the time, but over a third of prompts produced at least one response with no citations at all.
When ChatGPT decides to mention your brand, it's not just because your site content exists. It's because your brand has a narrative across the web that the model has internalized. When it pulls from training data, that narrative is built from everything it's absorbed: editorial coverage, forum discussions, product comparisons, industry conversations. When it references third-party sources, it's pointing to the same ecosystem. Either way, it's your digital footprint doing the work, not any single page on your site.
That's why I think of these recommendations as twofold. Earning "best of" mentions, high-authority backlinks, and domain authority aren't just citation tactics. They shape the narrative the web tells about your brand, which is the same narrative these models learn from, whether they're citing sources in the moment or not.
Industry Context Is Non-Negotiable
No metric reached significance across three or more industries. That alone should give pause to anyone selling a universal "AI optimization" framework. Travel and tech respond to authority signals. Cinema doesn't respond to much at all. B2B inverts the expected pattern. Any credible AI visibility strategy must start with understanding your own competitive landscape, not with generic best practices imported from a different vertical.
So What Do You Actually Do Monday Morning?
Research is valuable. But if it doesn't change what you do, it's just trivia. Here's what this data suggests for marketing teams trying to improve AI visibility.
1. Earn editorial coverage, especially "best of" content.
Being included in curated "best" lists was one of only five metrics that survived rigorous statistical testing across multiple industries. This is about being good enough that editorial writers include you unprompted. Invest in product quality, customer experience, and the kind of genuine differentiation that earns unsolicited editorial mentions.
2. Prioritize high-authority link sources over volume.
DA 60+ backlinks outperformed total backlinks as a predictor. Quality over quantity — stop chasing directories and guest post farms. Focus on earning coverage from publications, institutions, and platforms that the web (and LLM training data) treats as authoritative.
3. Run this analysis on your own competitive set.
These findings are industry-specific. Pull the same metrics for your actual competitors and see what your landscape looks like.
4. Track Citation Visibility and Mention Visibility separately.
They measure different things, so your strategy should depend on which type of AI visibility matters more for your business.
5. In B2B, go deep rather than broad.
Niche specialization may outperform broad web presence in B2B verticals. Own your category and don't dilute your brand by trying to be everything to everyone.
6. Don't optimize for AI. Build a brand worth talking about.
The strongest signal in this study is domain authority, a composite reputation score. You move that needle by doing things that make authoritative sites want to reference you, not by tweaking meta tags. By building a brand that's genuinely worth talking about.
Here's my prediction: LLMs can smell the BS. Because they're pulling from multiple sources, they're looking to confirm the most common narrative, the most consistent thread across the web. And you have more control over that narrative than most brands realize.
Everyone wants an easy lever to pull, and I get it. Telling you to "invest in brand" sounds maddeningly vague. But if you're looking for a long-term strategy that pays dividends across every channel, not just AI? Brand is it.
The Data Caveats We're Not Going to Pretend Don't Exist
We're being upfront about what this study can and can't tell you. Correlation isn't causation. We can say "brands with more backlinks also have more ChatGPT visibility." We can't say "getting more backlinks will make ChatGPT talk about you more,” because we haven’t been able to track this over time yet.
What we can say with confidence: out of roughly 350 statistical tests, only 5 metrics showed up consistently. The vast majority of what marketers assume drives AI visibility showed no signal at all.
The Data Doesn't Reward Shortcuts
The takeaway is simple: AI visibility isn't a new game with new rules. It's the same game it's always been. Brands that are trusted, well-regarded, and genuinely useful to their audience are the ones showing up in AI-generated answers. The brands that try to shortcut their way there with volume, paid media, or platform hacks aren't showing up at all. The data doesn't reward repetition. It rewards reputation.

Sonny Vasquez
Manager, SEO