This post was originally written in 2017, and last updated in 2020.
What is Google Data Studio?
Google Data Studio (GDS) is a great, free data visualization tool (note my use of the phrase data visualization tool, as opposed to business intelligence tool here) that lets you build interactive dashboards, and customized, beautiful reporting.
A majority of Data Studio's features are easy to use, and it allows for easy sharing and scheduling of reports. We use Data Studio to track key KPI’s for clients, visualize trends and compare performance overtime.
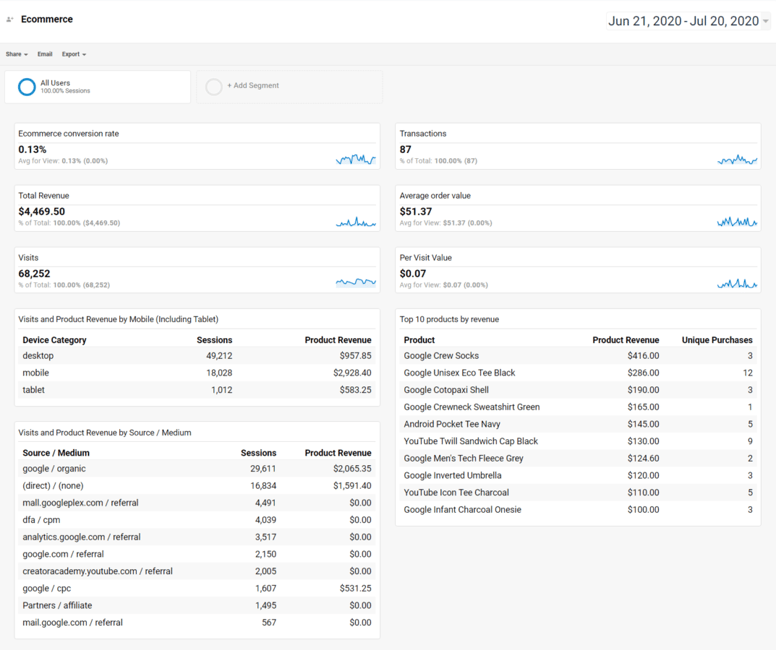
Data Studio is basically a supercharged version of the ol’ Google Analytics dashboard, which is incredibly limited in terms of functionality (12 widgets per dashboard and can only connect to the data in the particular view the dashboard is in).
Google Analytics Dashboard
Data Studio Dashboard
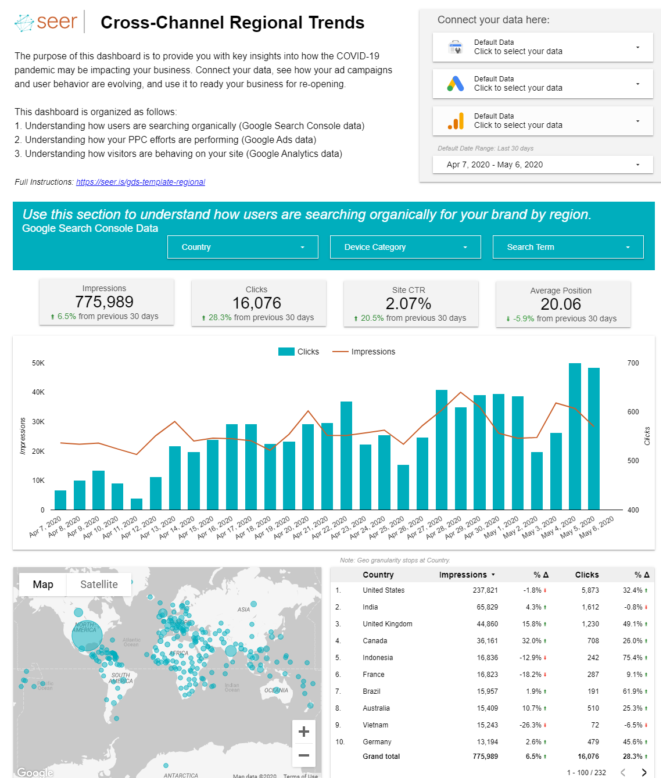
As you can see, these two are world’s apart.
What are the Benefits of Using Data Studio?
Why is Google Data Studio so great, you ask? When using Data Studio you have access to the following key features (more to come on each of these later!):
- Live data connection and access to over 220 connectors
- Full control over customization of reports and visuals, including adding as many pages or charts as needed
- Dynamic controls with report and page level filters
- Advanced formulas such as calculated metrics and calculated fields
How to Use Google Data Studio
Live Data Connection
Data Studio has built-in connections to over 200+ data sources (full list here) eliminating the need to schedule periodic data refreshes for your reports.
Having a live data source also means you’re not limited in terms of what date range you can look at. Depending on how far back your data goes, you can use any date range that satisfies your needs.
You can connect to multiple data sources within the same report, and visualize data across different datasets. Check out our template here that incorporates data from Google Search Console, Google Ads, and Google Analytics: Data Studio Template for Monitoring Regional Trends during Reopenings.
Full Customization Controls
Data Studio gives you license to add pages, charts and tables as needed (although there are some limitations when it comes to scorecards specifically), and customize to your heart’s content.
You can customize your dashboards with your company colors, or even your clients'.
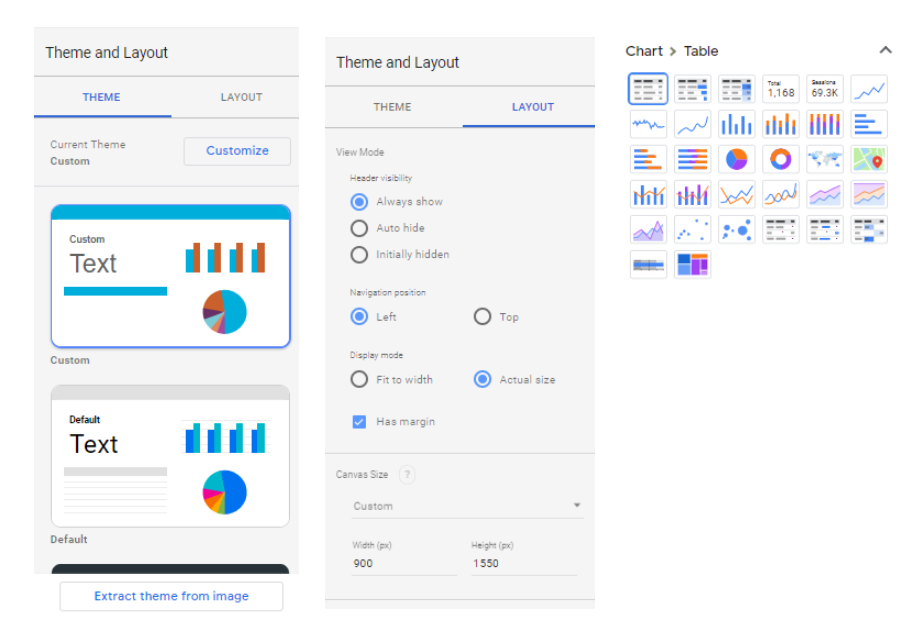
- You can select pre-filled themes, or create a custom theme based on your own preferences. You also have the option to extract a theme from images, if you want to get really creative.
- You can edit the layout, including your page size, alignment etc.
- Data Studio gives you a wide array of charts and visuals to work with, starting with the basics such as bar charts and line charts, all the way to the newly released Google Maps visual.
- You can use conditional formatting to show pacing to goals and targets (for how to do this, see 2 Ways to Use Conditional Formatting in Data Studio).
Dynamic Controls
One of the reasons our clients love Data Studio is because of the dynamic control feature, that gives them significant ability to slice and dice their data without having to update the report setup itself. With Data Studio, you can:
- Insert dynamic controls so viewers can filter through the content with dimension and date range selectors.
- Include and exclude content from a filter if there’s ever a situation where you don’t want all the content on the page to change.
Drill Down Hierarchy
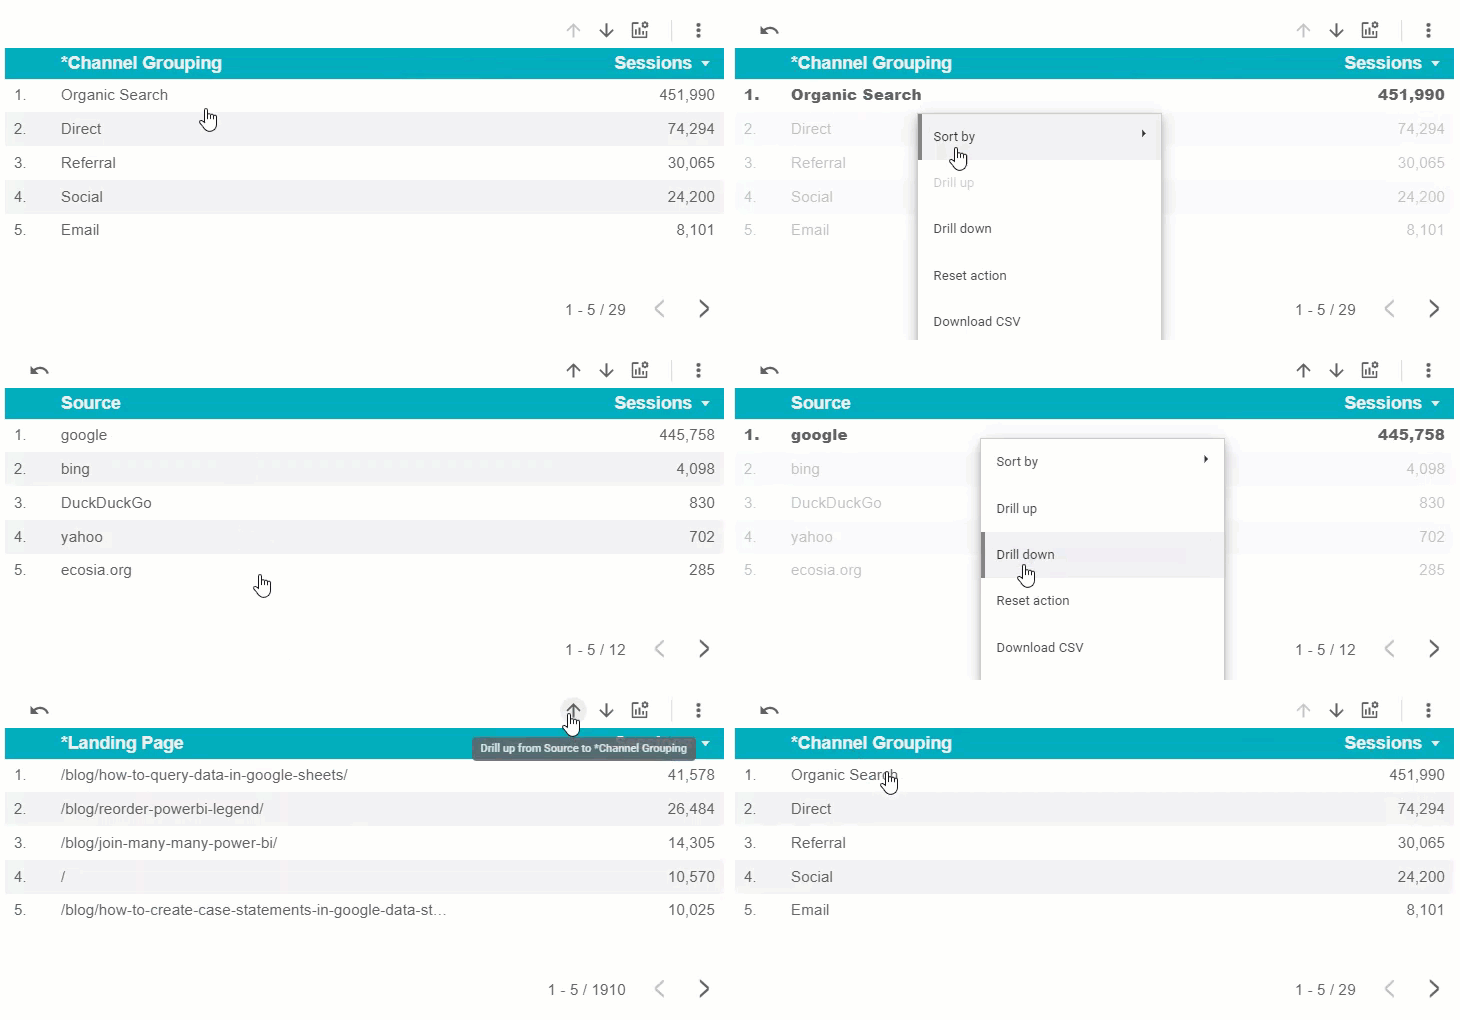
This feature lets you explore additional details within a chart, you can access more detailed information as you “drill down” into a chart e.g. from Country to City, or “drill up” from more detailed information to more high level data.
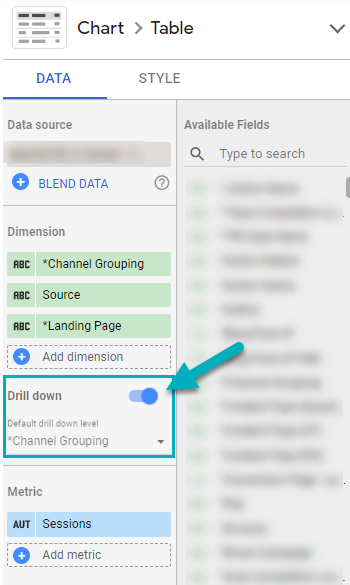
As Google says, “adding drill-down charts to your reports can make them more interactive, reduce the number of separate charts required, and make it easier to find insights at various levels of detail in the data.”
Optional Metrics
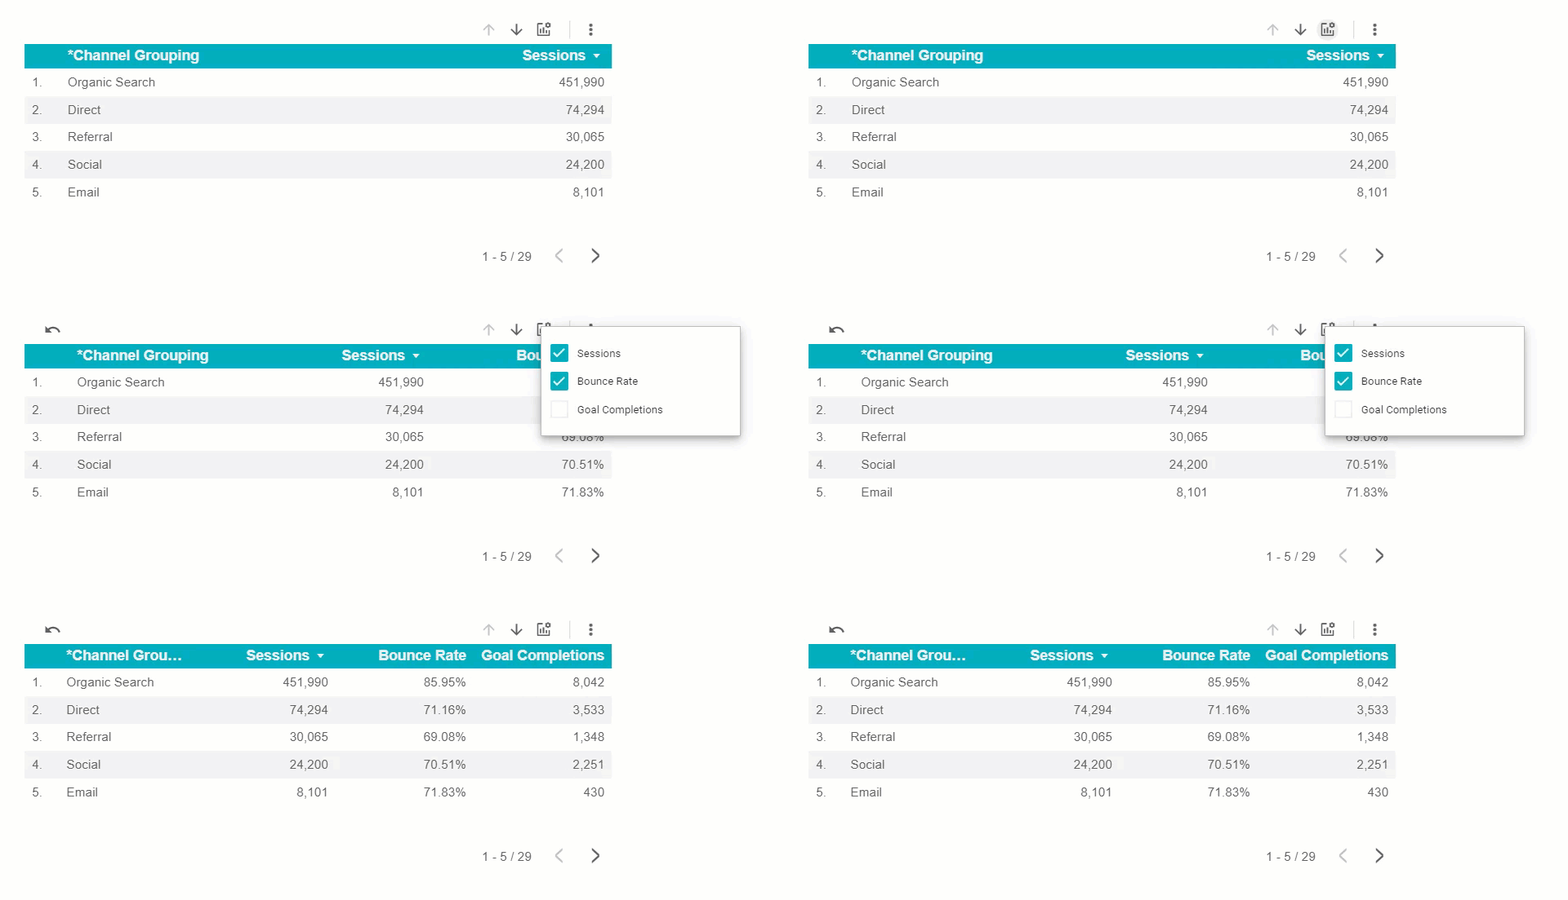
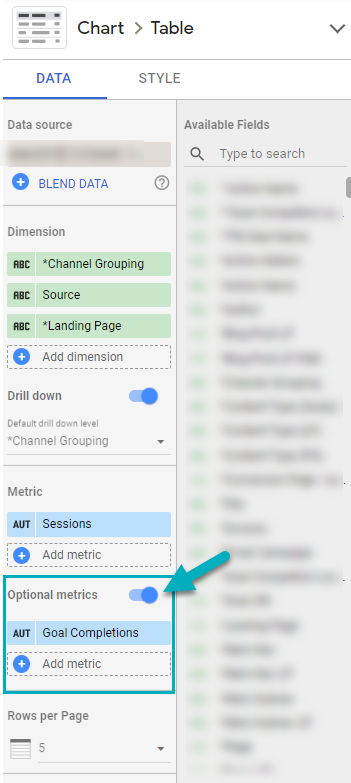
You can give the user an additional layer of control by selecting Optional Metrics they can access, and allow them to customize what they’re looking at without having to edit the original report.
To access optional metrics once you’ve selected a chart, in the properties panel under Metric, turn on Optional metrics. Then click +Add metric or drag the metric from the Available fields panel and into the chart as an optional metric. Users can now access optional metrics once they hover over the chart. See below for a visual of the feature:
 Custom Bookmarks
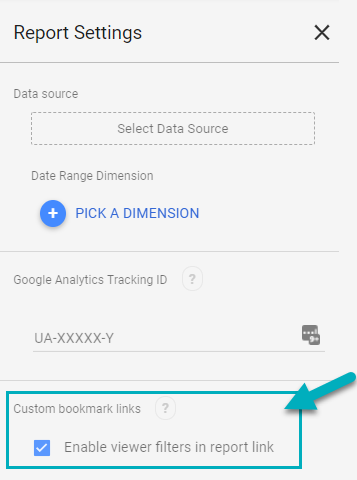
All these dynamic controls are great, but what if you’re using the report on a regular basis and want to preserve your settings? Well, Data Studio has a custom bookmark feature that lets you do exactly that.
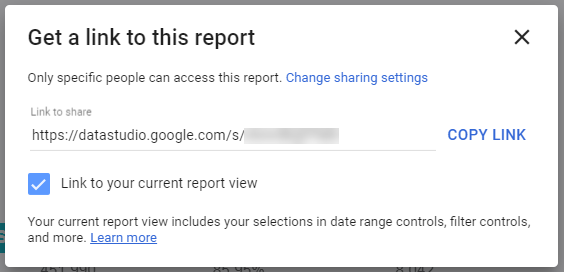
From Google, “when you enable custom bookmark links for a report, the viewer's filter settings are added as parameters to the report's URL. This gives your viewers an easy way to get back to their preferred view of the data by bookmarking the link.”
To enable custom bookmarks, select File > Report Settings. Under Custom Bookmark Links, click Enable viewer settings in report link.
Advanced Formulas
With advanced formulas, Google Data Studio goes from being a simple visualization tool to giving you the ability to transform your data as needed, and it allows you to paint a powerful picture with your data.
Calculated Fields
Use when your out of the box fields and metrics just aren’t cutting it. Calculated fields allow you to create new or custom metrics or dimensions in Google Data Studio from your existing data. You can perform calculations, create categories, or transform your data with calculated fields.
For more on this, read 10 Ways to Use Calculated Fields in Google Data Studio.
In addition, I’ll dig into one of the most powerful uses of calculated fields below, in the form of case statements.
Case Statements
Return dimensions and metrics based on conditional expressions. A CASE statement lets you create new fields using conditional logic to determine the field values. CASE is most often used to create new categories or groupings of data.
An example for how you’d use case statements might be to categorize your source/mediums into new Channel Groupings in Data Studio (that are retroactive, unlike Google Analytics’ Default Channel Groupings).
Dig in deeper on case statements, check out How to Create Case Statements.
What’s Missing?
Like all tools, Data Studio comes with its own set of limitations.
Formatting Matters
Formatting in Data Studio is unique to Data Studio, meaning it doesn’t work the same way as Google Sheets etc. This means people often run into issues with their data not working as expected, as they haven’t formatted their data correctly.
Data formatting has to happen in the original data source for GDS to be able to interpret it. If you are connecting automatically to one of Data Studio's native connectors (read: Google Analytics, Google Ads, Search Console, etc.) you don't have to worry about formatting your dates. GDS does that all for you.
However, say you are using a raw data connector like Google Sheets, Excel/CSVs, etc. In that case, this step is absolutely critical:
In order to work with dates properly, your data source must have at least one dimension of type Date (YYYYMMDD).
Not a Business Intelligence Tool
Data Studio’s analysis chops are not on par with the top business intelligence (BI) tools currently in the market (Tableau, Power BI to name a few). While it effectively visualizes your data, it doesn’t allow you to slice and dice and analyze your data in nearly as many ways as those tools do.
Data Blending Feature is in Early Stages
In July 2018, Data Studio added a feature called Data Blending to it’s arsenal. You can use it to join data from different sources for better dashboards and more in depth reporting. However, you’re limited to blending up to 5 data sources in a chart, and blending data currently only supports left outer join operations.
Functionally, it can take a bit of effort playing around with formatting and the joins itself to get your joins working, but we only expect this feature to improve and get stronger.
What Now?
Keep reading to learn more about Google Data Studio:

