In the past ~two months since the national stay-at-home order was declared, we’ve seen businesses scramble to adapt to rapidly changing customer demands and behavior in the ‘new normal’. But if businesses are not fueling their evolution with their own data, these efforts are very much a best-guess.
More than ever before, keeping a tight pulse on user behavior on your website and your digital marketing efforts is vital to surviving, and thriving. Additionally, it’s also important to understand how change in online behavior may vary between regions is important to your business. We created a template for monitoring the impact on website data a few weeks ago here, but in this post we're focusing on a dashboard to help you monitor regional trends to prepare for businesses re-opening.
This plug-and-play Looker Studio template uses cross-channel data from Google Search Console, Google Ads, and Google Analytics. If you’re ready to get started, go ahead and make a copy of the template below:
How to Set Up Your New Dashboard

1) Make a Copy & Connect Your Data
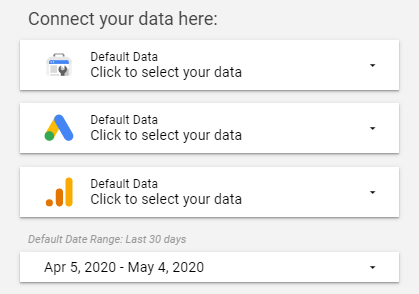
Ensure that you’re logged into the Google account that has access to your Google Search Console, Google Ads, and Google Analytics data, and add the main reporting views as the new data sources.
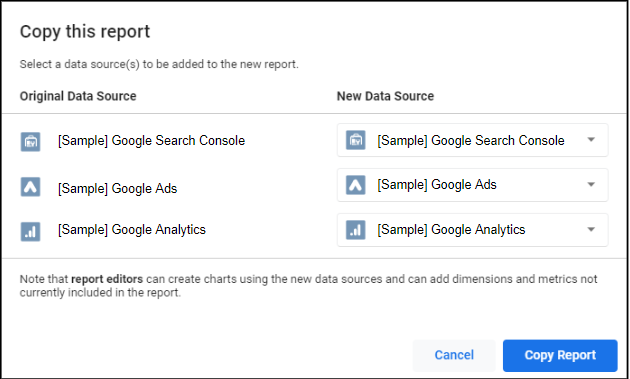
After clicking “Copy Report”, it will use your data source to create an adjustable copy of the dashboard. We recommend that you give the dashboard an initial scan to ensure that no visuals broke during the data source transfer.
If the report breaks, we recommend re-copying and running through the instructions again step by step. If that fails, please reach out to us in the comments below to assist in troubleshooting.
2) Schedule Email Delivery
Looker Studio has an automated email delivery feature that allows you to send an up-to-date copy of your dashboards to your inbox on a predetermined basis. At Seer, we like to send our dashboards to our inboxes every Friday so that we have a weekly reminder to check on our data.
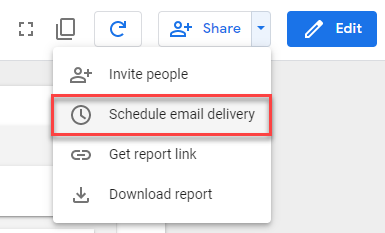
Here’s how to set up automated email delivery in Data Studio:
Click the drop down menu next to Share and choose “Schedule email delivery”.
Next, add the appropriate recipients and choose your delivery cadence.
If you have multiple Google Search Console, Google Ads, and/or Google Analytics views to monitor, we recommend making a copy of the dashboard for each different view, as the automated email delivery will send a copy of the dashboard using the current data source.
You can schedule it to send every day if you’d like to use it as a daily gut check — but keep the other Share options in mind if you’d rather it live outside of your inbox.
3) Toggle Your Data Connectors
If you’re juggling between multiple Google Search Console, Ads, and/or Analytics Views, you can also use the data control feature that allows you to change between different data sources (as long as they are within the same Google account).
This will allow you to easily review your multiple Google Search Console, Ads, and Analytics views without having to create multiple dashboards. If you don’t want to take the time to create individual dashboards for each of your views, you may find this method is simpler.
How to Interpret this Dashboard to Make Decisions
This dashboard is laid out to reflect the marketing funnel -- starting with high-level organic search data, and ending with more granular website data.
Below is our walkthrough of how to set it up, interpret, and use the template and its data connectors.
Google Search Console Data

Use this section to understand how users are searching organically on Google for your brand by region. Gain valuable insights into broad search trends that could indicate when customers are ready to buy from your business again.
Look out for changes in your Google Search Console data -- upward trends in impressions for a search term (or set of search terms) is a quick way to spot user intent in your business for that term. Additionally, monitoring changes in impressions for search terms in regions that were not previously seen, is a quick way to spot new consumer interest that you can address with new content if clicks aren’t rising along with impressions.
Google Ads Data

Use this section to understand how your paid search efforts are performing for your brand by region. As businesses scrutinize budgets, this section can help you identify money-wasters.
Here, you can drill down into which ad groups/campaigns are performing well, as well as which underperforming tactics could potentially be cut out to reallocate budget.
Check out Wil’s post, "Marketing During a Recession" to learn more about making smart decisions and budget cuts during this time.
Filter the PPC section by Campaign and Ad Group to identify low-performing Google Ads tactics where you could be better allocating your marketing budget. Drill down in the geo map to see where your Google Ads efforts are performing well, which could tell you that your audiences in these areas may be resuming their spending activity.
As a next step, you could use these insights to redirect PPC budget to these high-performing regions or make bid adjustments for low-performing regions.
Google Analytics Data

Use this section to understand how users are behaving on your site by region. Filter by traffic sources to see which marketing channels are high performers, and where your valuable traffic is coming from. We’ve also included goal performance and Ecommerce performance to tie marketing efforts to your business goals.
Leverage your Google Analytics data to inform you of important shifts in site behavior. Use the Internal Site Search by Region table to understand new trends in what potential customers are looking for on your site -- perhaps you’ll find visitors are suddenly interested in a particular product, or perhaps they are searching for careers on your site, or for blog content.
You can then bring this information to your UX team for some site optimization! Or consider using Google Optimize new banner feature to personalize the content users see depending on what region they’re in and noted trends in internal searches.
The four-goal performance scorecards will allow you to quickly understand which site goals are performing. Layer this with regional data to see where high-quality visitors are coming from, which could inform retargeting for higher conversions.

Be sure to update the Google Analytics Goals as they need to be manually updated upon each duplication. Additionally, if you don't sell products on your website, make sure to remove those metrics and replace them with others more relevant to you.
Continue Monitoring Regional Data Regularly
Your geographical data is more important now than ever. We hope that by using this dashboard to monitor regional trends will help you be ahead of the curve for when your business re-opens. We recommend checking the dashboard multiple times per week to ensure you are staying up to date with shifting updates to regional closings.
Let us know in the comments if you found this template useful or if there are any others you'd like to see (& we'll see what we can do!)
Interested in Seer helping your business via digital marketing services? Feel free to reach out to us here -- we'd love to work together.
Sign up for our newsletter for more posts like this - delivered straight to your inbox!