You did it. Your site is tagged for Enhanced Ecommerce. You’ve turned on Enhanced Ecommerce in your Google Analytics view. Even better: you trust your data!
Congratulations, you’ve made it to the fun part - analyzing the Enhanced Ecommerce and understanding your customers’ buying behaviors.
Not there yet? Learn more about setting up Enhanced Ecommerce, the difference between Enhanced vs Standard Ecommerce, and more from Google here.
In this post, we'll walk through the types of Enhanced Ecommerce or "EEC" reports, how to use them, what to use them for, and our recommendations for ways to analyze your EEC data at scale.
Types of Enhanced Ecommerce Reports
Let’s break down the cast of characters when it comes to Ecommerce.
Once you have EEC implemented and turned on, you have some interesting insights waiting to be found.
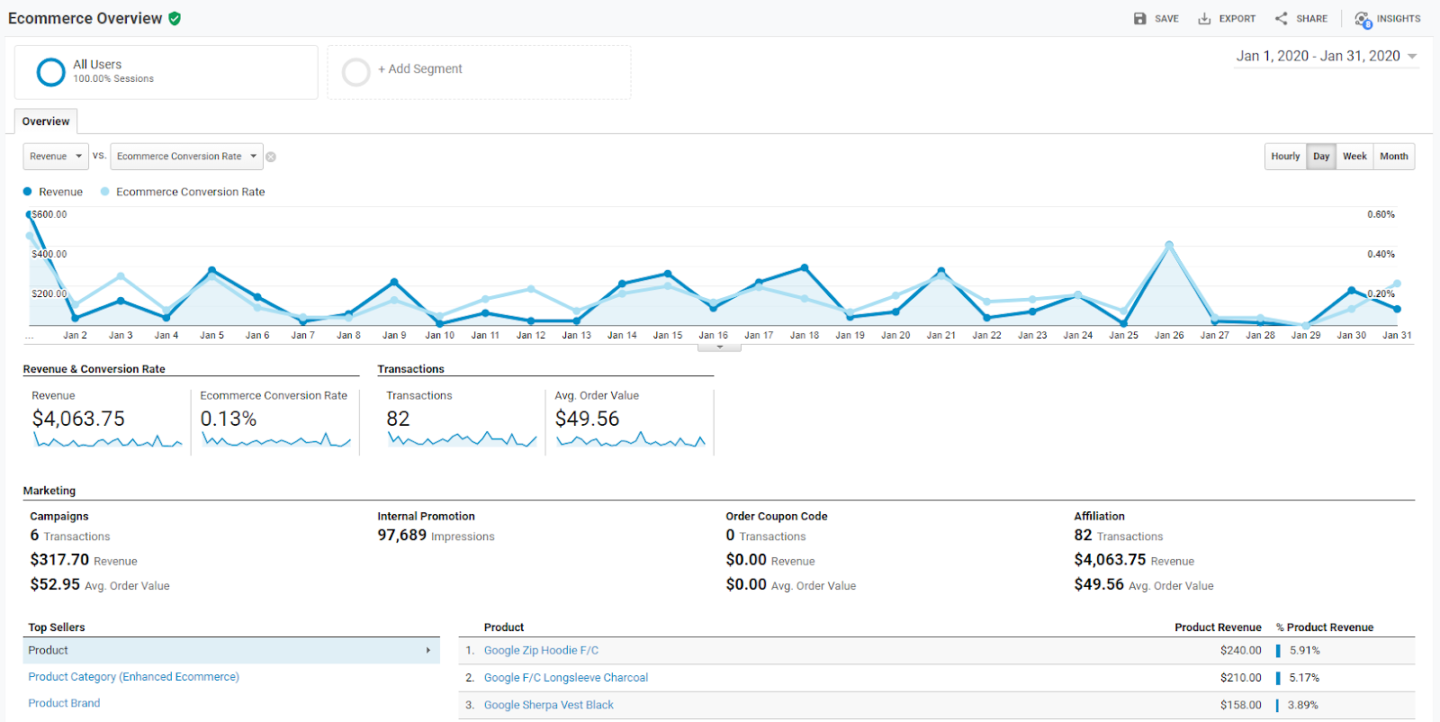
Ecommerce Overview: The Backbone
Basic, quick hitting summaries on key metrics: revenue, Ecommerce conversion rate, transactions, average order value, marketing, and top sellers.
The "Ecommerce Overview" report is the backbone of what you’ll report up to the rest of the team.
Shopping Behavior: The Browser
The Shopping Behavior report is a funnel-based report that indicates where people drop off in the buyer journey.
From All Sessions, to Sessions with Product Views, all the way down to Sessions with Transactions, you can follow your funnel and identify room for growth.
Shopping Behavior identifies the browsers vs. the buyers so you can optimize toward them at the right stage in their journey.
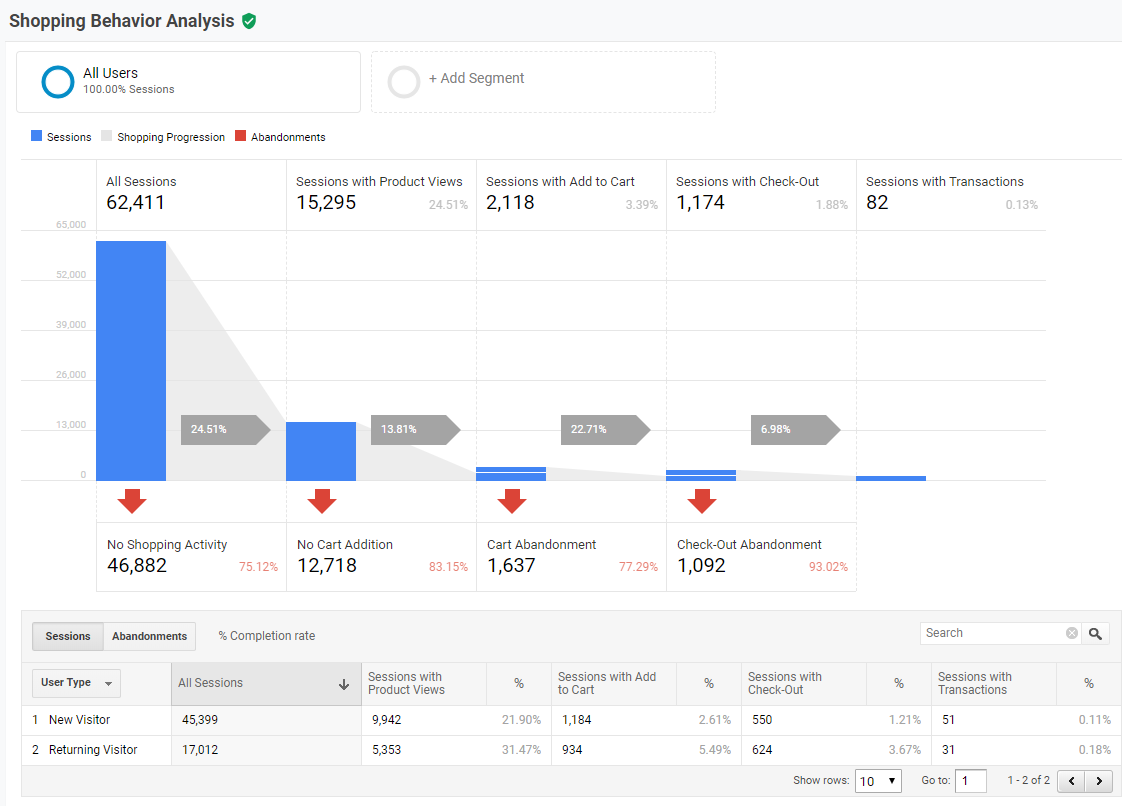
The Shopping Behavior Analysis includes how many sessions followed the normal purchase flow from one step to the next, how many sessions started directly at that step, and how many sessions abandoned the funnel at that stage. The chart highlights the following features:
- All sessions in the report are shown in blue.
- The shopping progression, or the movement of users from one shopping stage to the next, is shown in gray.
- The abandonment of each stage of the funnel is shown via a downward red arrow.
The Shopping Stage name is internal to Google Analytics and cannot be changed, even if a custom name is configured in the Enhanced Ecommerce settings.
Here’s how Enhanced Ecommerce shopping-stage dimensions map to funnel-step metrics:
| Shopping-stage dimension | Funnel-step metrics |
| ALL_VISITS | All Sessions |
| NO_SHOPPING_ACTIVITY |
No Shopping Activity Exited first step without a detail, add, checkout, or purchase action sent with hit |
| PRODUCT_VIEW |
Sessions with Product Views At least 1 detail action sent with hit |
| NO_CART_ADDITION |
No Cart Addition At least 1 detail action, but no add, checkout, or purchase action sent with hit |
| ADD_TO_CART | Sessions with Add to Cart |
| ADD_TO_CART_WITHOUT _VIEW |
Sessions with Add to Cart (top slice) Entered funnel at this step, no detail action sent with hit |
| ADD_TO_CART_WITH _VIEW |
Sessions with Add to Cart (bottom slice) At least 1 detail action sent with hit, includes previous and current step |
| CART_ABANDONMENT |
Cart Abandonment At least 1 add action, but no checkout or purchase action sent with hit |
| CHECKOUT | Sessions with Checkout |
| CHECKOUT_WITHOUT _CART_ADDITION |
Sessions with Checkout (top slice) Entered funnel at this step, no add action sent with hit |
| CHECKOUT_WITH_CART _ADDITION |
Sessions with Checkout (bottom slice) At least 1 add action sent with hit, includes previous and current step |
| CHECKOUT_ABANDONMENT |
Check-out Abandonment At least 1 checkout action, but no purchase action sent with hit |
| TRANSACTION |
Sessions with Transactions At least one purchase action sent with hit |
|
TRANSACTION _WITHOUT_CHECKOUT |
Sessions with Transactions (top slice) Entered funnel at this step, no checkout action sent with hit |
|
TRANSACTION _WITH_CHECKOUT |
Sessions with Transactions (bottom slice) At least 1 checkout action and 1 purchase action sent with hit, includes previous and current step |
The funnel visualization helps to identify strengths and weaknesses in your purchase funnel.
The below table highlights how you may convert issues to action:
| Potential Issue | Solution |
| Large percentage of sessions do not include any shopping activity | Evaluate your marketing efforts. You are likely getting low quality traffic. |
| Large percentage of sessions include a product view without an add to cart | Evaluate the content of your product detail pages. There could be issues with your product description, product image, or functionality of the page itself. |
| Large percentage of sessions include an add to cart without a checkout | Evaluate the offers and pricing of similar products offered by your competitors. People may be abandoning the shopping cart when they find a better price or offer elsewhere. Consider remarketing campaigns to get these customers back into your checkout funnel. |
| Large percentage of sessions in which the checkout process was started but no purchase was made | Evaluate your checkout process and look out for issues like unexpected costs, complicated navigation, limited payment options, high shipping charges. |
Checkout Behavior: The Closer
Another funnel! The Checkout Behavior report is also funnel-based, and shows drop-offs in each stage of your checkout process.
This is "the closer" because it shows the actual steps users take to buy something on your site, and where they’re having a hard time making the purchase.
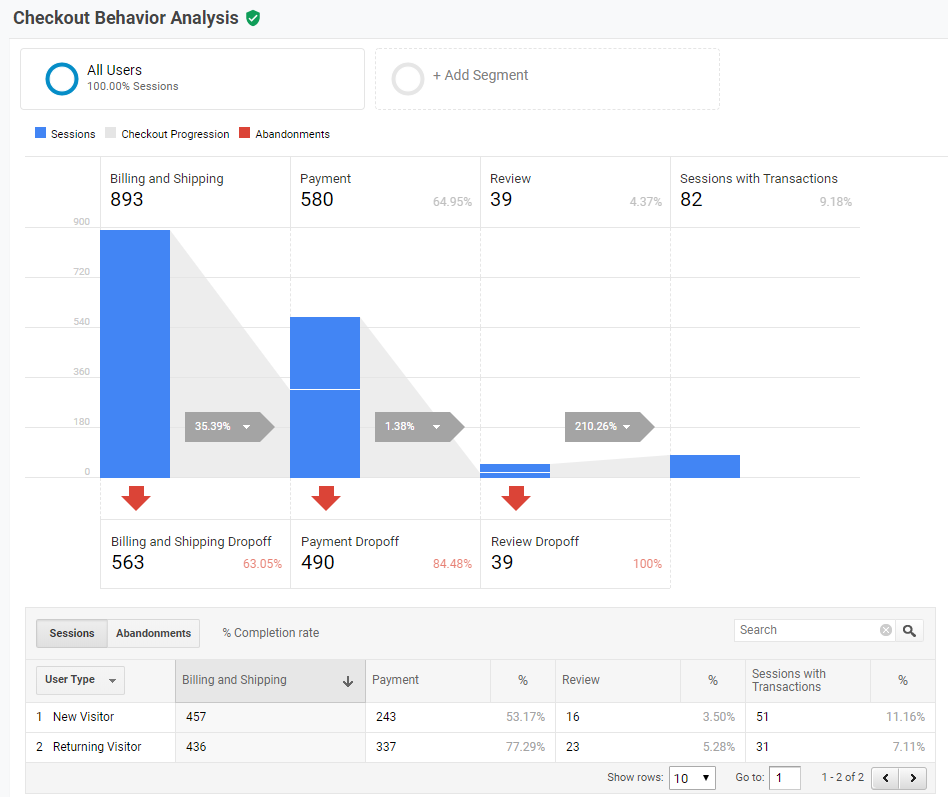
Through the Ecommerce settings in the Google Analytics interface, each step in your checkout process can be given a descriptive name that will be used in reports.
Here’s how checkout steps will map to the funnel metrics:
| Checkout-behavior dimension | Funnel-step metrics |
| CHECKOUT_1 |
Checkout Step 1, e.g., Billing Sent with hit: at least 1 checkout action with Step = 1 or at least 1 checkout action with no step specified |
| CHECKOUT_1_ABANDONMENT |
Checkout Step 1 abandonment, e.g., Billing Dropoff Sent with hit: at least 1 checkout action with no step specified or with Step 1 specified, but no subsequent checkout or purchase steps |
|
CHECKOUT_2_WITHOUT _CHECKOUT |
Checkout Step 2 (top slice), e.g., Shipping Entered funnel at this step, no checkout action with Step = 1 sent with hit |
| CHECKOUT_2 |
Checkout Step 2 (bottom slice), e.g., Shipping At least 1 checkout action sent with hit, includes previous and current step |
| CHECKOUT_2_ABANDONMENT |
Checkout Step 2 abandonment, e.g., Shipping Dropoff Sent with hit: at least 1 checkout action with Step = 2, but no subsequent checkout or purchase steps |
|
CHECKOUT_3_WITHOUT _CHECKOUT |
Checkout Step 3 (top slice), e.g., Payment Entered funnel at this step, no checkout action with Step = 2 sent with hit |
| CHECKOUT_3 |
Checkout Step 3 (bottom slice), e.g., Payment At least 1 checkout action sent with hit, includes previous and current step |
| CHECKOUT_3_ABANDONMENT |
Checkout Step 3 abandonment, e.g., Payment Dropoff Sent with hit: at least 1 checkout action with Step = 3, but no subsequent checkout or purchase steps |
|
CHECKOUT_4_WITHOUT _CHECKOUT |
Checkout Step 4 (top slice), e.g., Review Entered funnel at this step, no checkout action with Step = 3 sent with hit |
| CHECKOUT_4 |
Checkout Step 4 (bottom slice), e.g., Review At least 1 checkout action sent with hit, includes previous and current step |
| CHECKOUT_4_ABANDONMENT |
Checkout Step 4 abandonment, e.g., Review Dropoff Sent with hit: at least 1 checkout action with Step = 4, but no subsequent checkout or purchase steps |
| TRANSACTION |
Sessions with Transactions At least one purchase action sent with hit |
|
TRANSACTION_WITHOUT _CHECKOUT |
Sessions with Transactions (top slice) Entered funnel at this step, no checkout action with Step = 4 sent with hit |
|
TRANSACTION_WITH _CHECKOUT |
Sessions with Transactions (bottom slice) At least 1 checkout action and 1 purchase action sent with hit, includes previous and current step |
Product Performance: The Band
This is your whole motley crew of products. Each product makes up the full band of your company’s success, so this report identifies each product individually and digs in on their success or need for improvement.
You can also dig into Product Category, looking into specific sections of your product performance.
Again, kind of like a band. If your rhythm section is slacking, you hone in on them. EEC will show you the same.
Sales Performance: The Benjamins
It’s all about the Benjamins in this report. This breaks down individual transactions, and focuses on sales at the core.
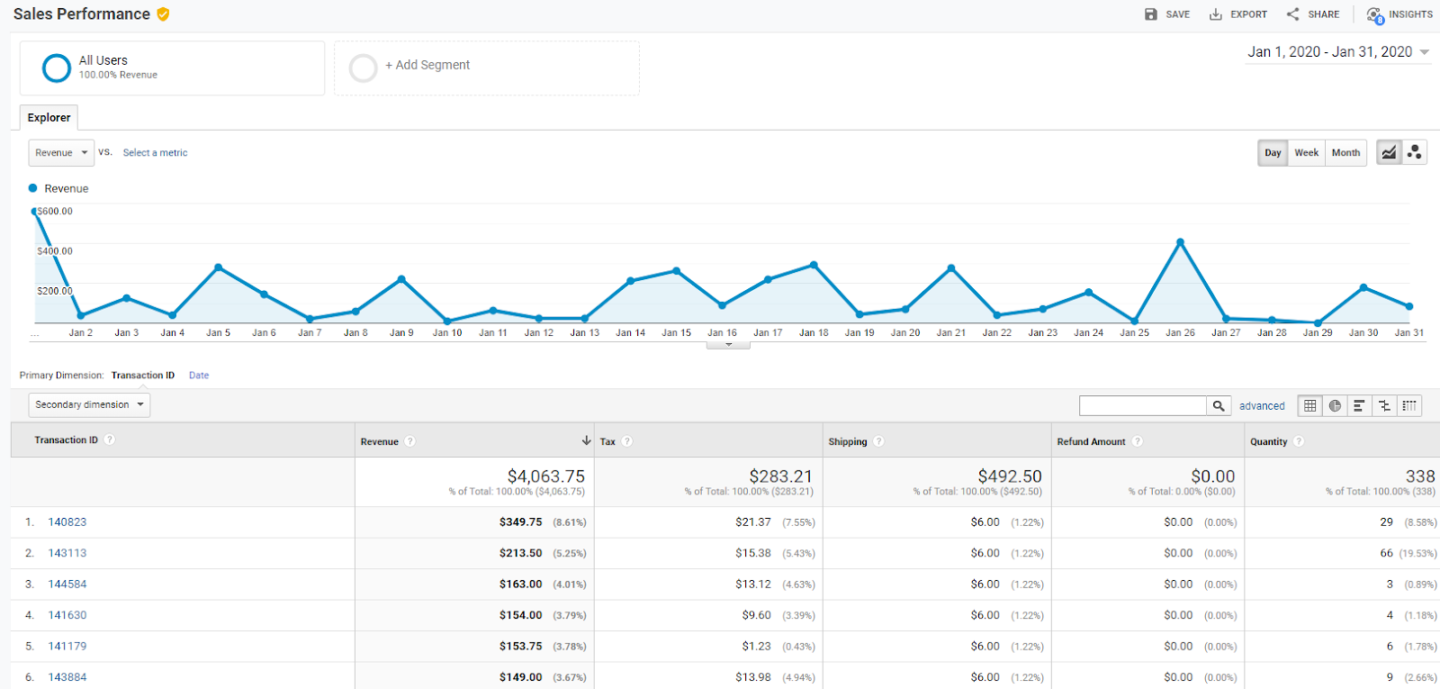
Transaction ID is typically something assigned by your chosen Ecommerce hosting platform (think: Shopify, Magento, so on). You can use this report in tandem with your actual sales data in your CRM to compare and contrast the integrity of data in Google Analytics.
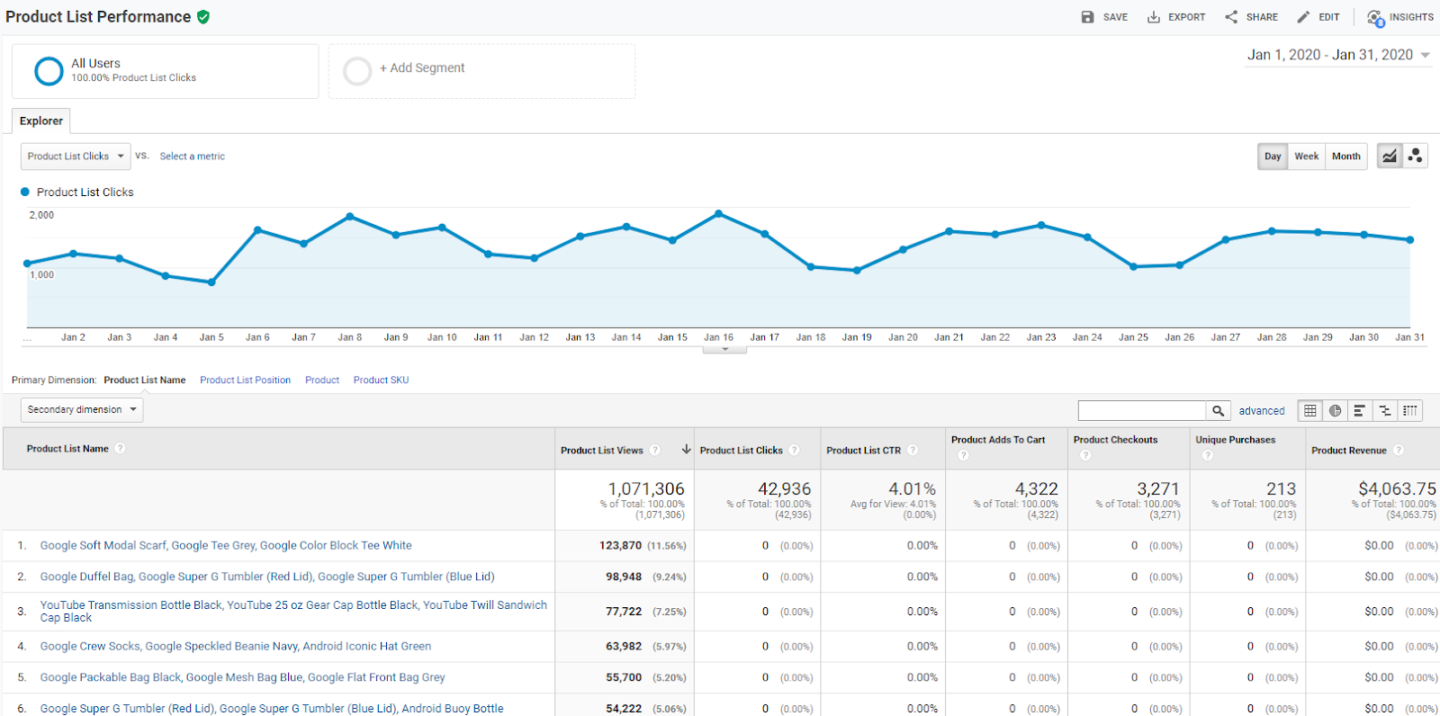
Product List Performance: The Cliques
The Product List report is like a group of different cliques that fit together.
Product Lists group products in a way that makes sense to your business. They could be built around “similar product” groups, “up-sell” groups, or whatever may make sense. These cliques are comprised of unique products that just make sense together.
Marketing Reports: The Assists
Additionally, there are Marketing Reports to help identify how your promotions, coupons, and affiliate codes affect actual purchases on-site.
- Internal Promotion
- Order Coupon
- Product Coupon
- Affiliate Code
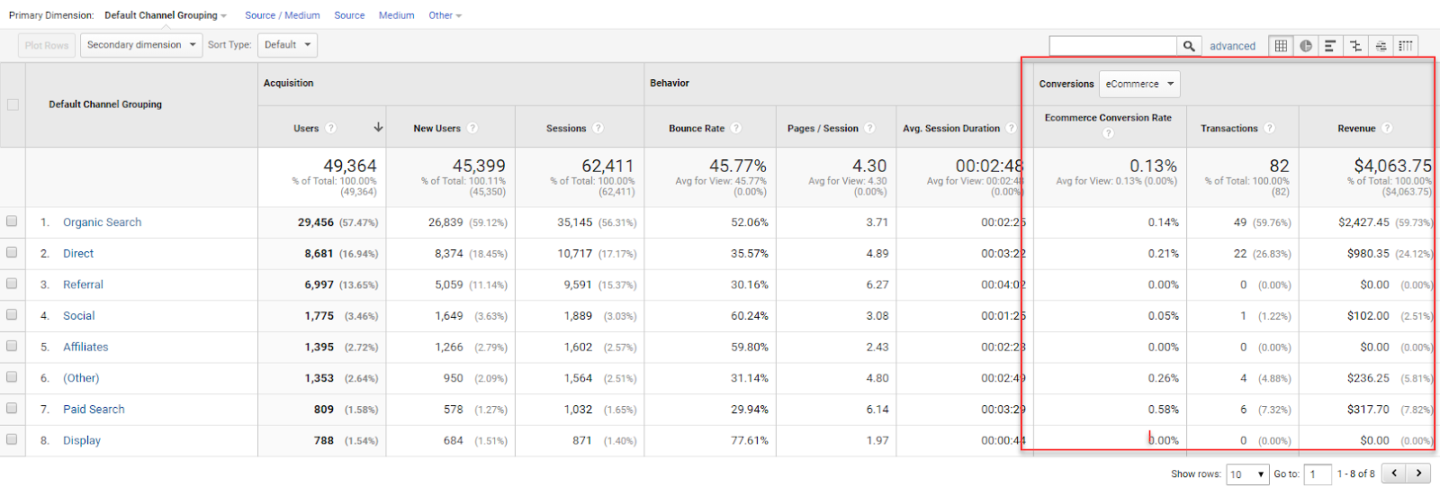
Customer Acquisition & Enhanced Ecommerce
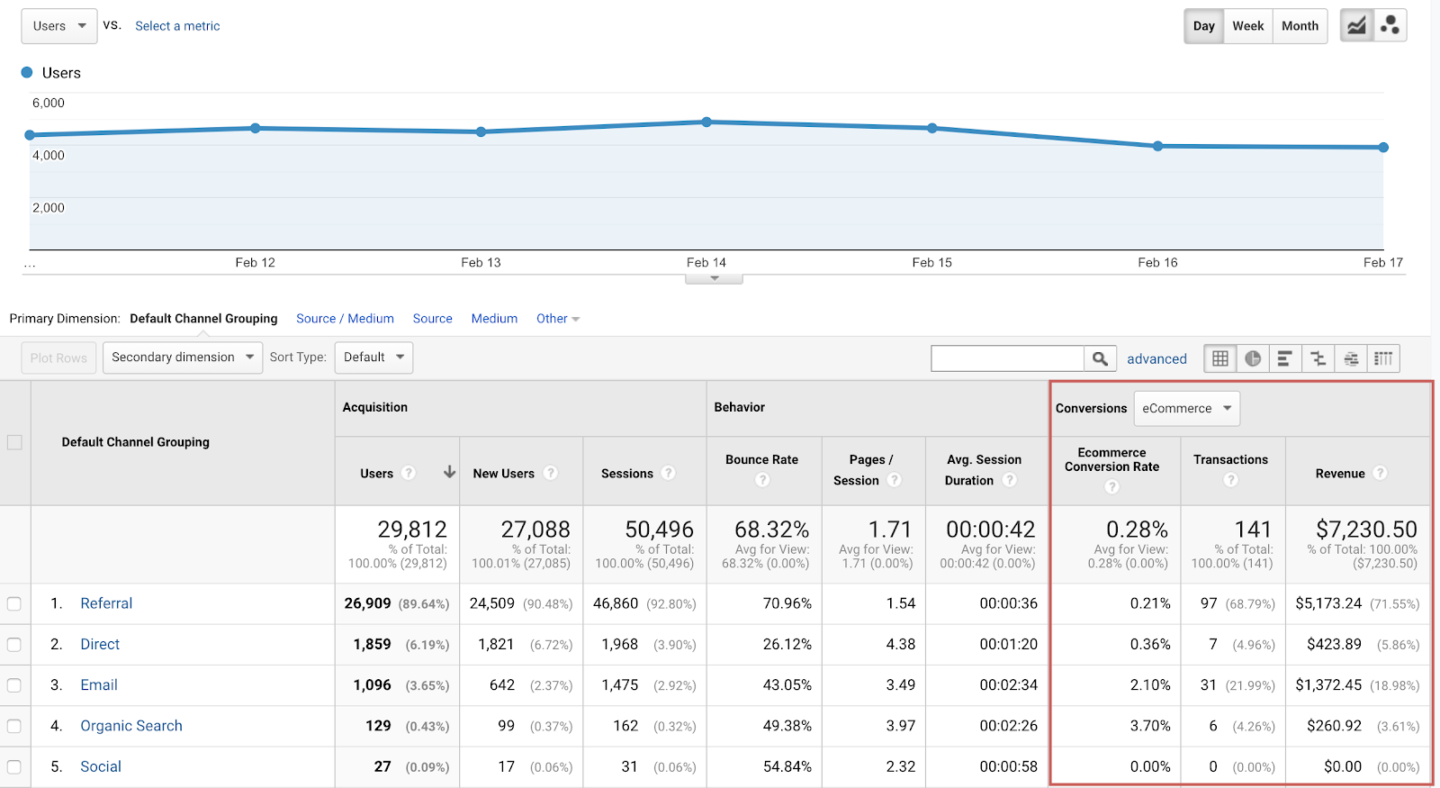
The Acquisition report not only highlights where users are coming from, but also which of your marketing efforts are working. While you can access this particular report via Acquisition > All Traffic > Channels, you can also compare the success of your marketing efforts by Source/Medium and by Referral source.
Once Ecommerce Tracking enabled, you’ll see these last 3 Ecommerce columns for each acquisition report.
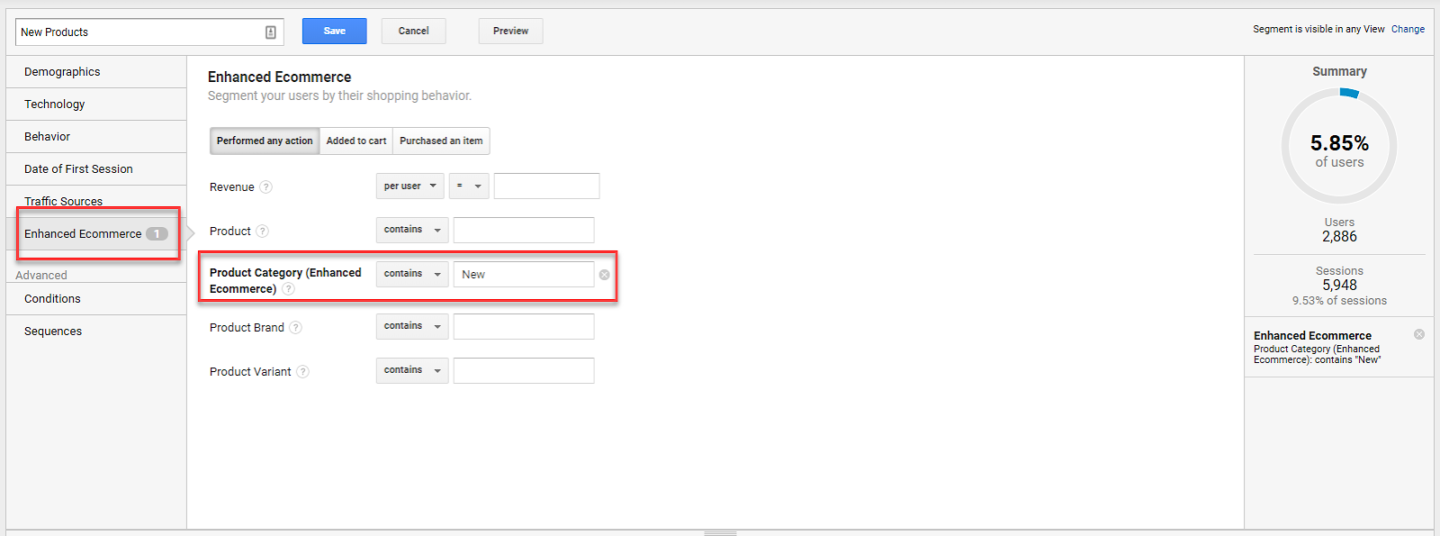
Enhanced Ecommerce Segments
Segments take your Ecommerce analysis to the next level. If you want to dig deeper on certain audiences, site sections, or actions, create a relevant segment and set it against your Ecommerce reports.
Once you have EEC implemented, you’ll notice that you can use the “Enhanced Ecommerce” section of segmentation, highlighted in the below screenshot. You can build a segment identifying users by shopping behavior. This has multiple benefits, both for analysis and for retargeting audiences.
Below, we created an example segment around users who have performed any action with any product within the “New” product category.
Enhanced Ecommerce Analysis Starters
Sometimes, we all need a conversation starter. Here’s a few “Analysis Starters” for when you need a little inspiration to help break through the analysis paralysis block when digging into your EEC data.
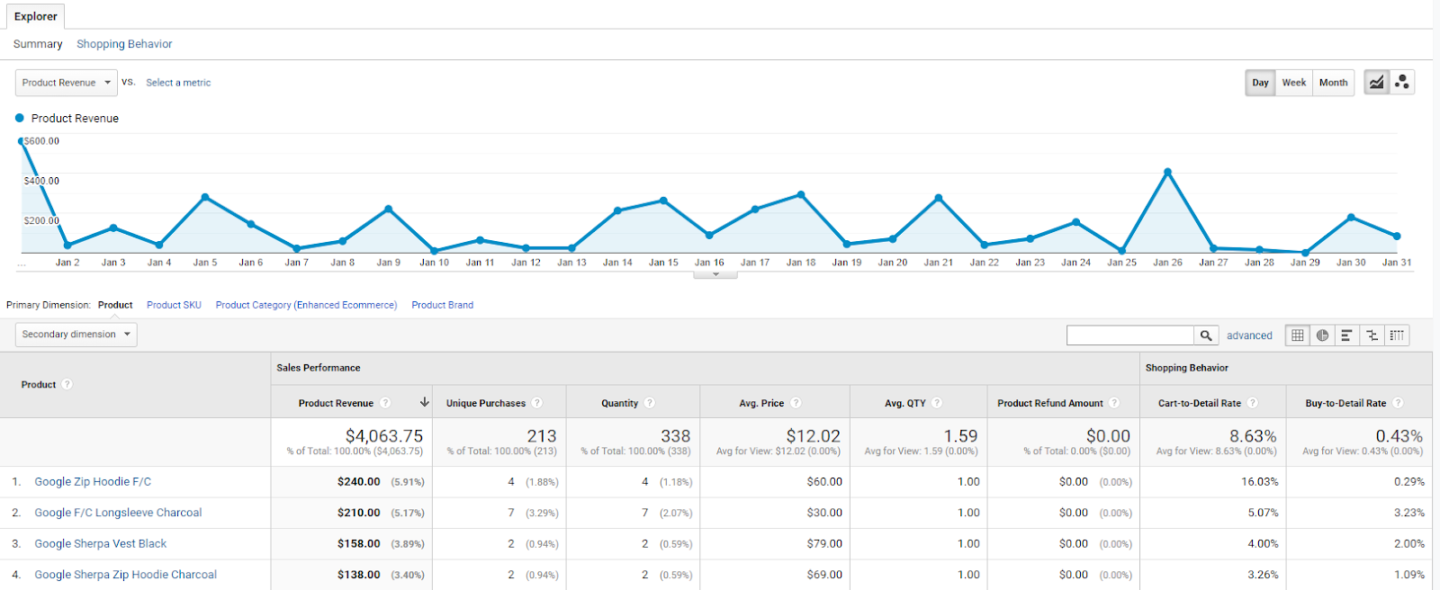
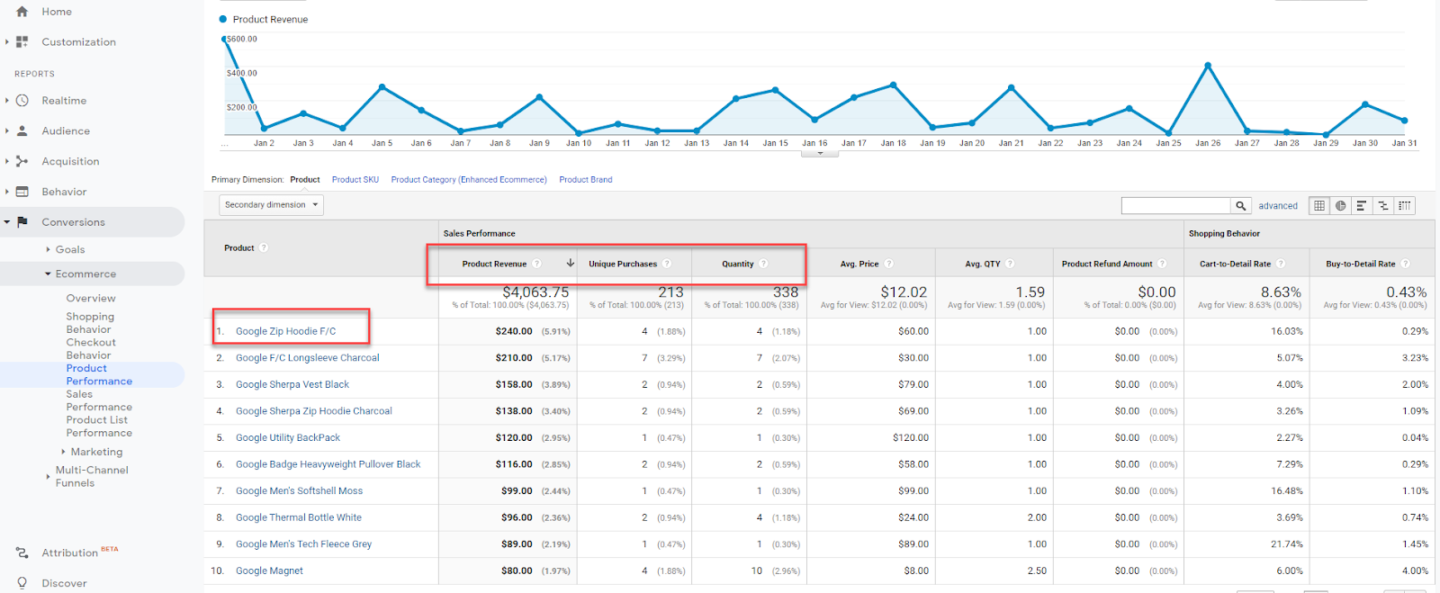
What products are the most popular?
- First, ask yourself - what do you care most about in terms of “popularity”? Do you want to see the products with the most revenue, unique purchases, or quantity of purchases?
- Then, sort by the metric you value most. In this case, we looked at products in the month of January 2020 that drove the most revenue.
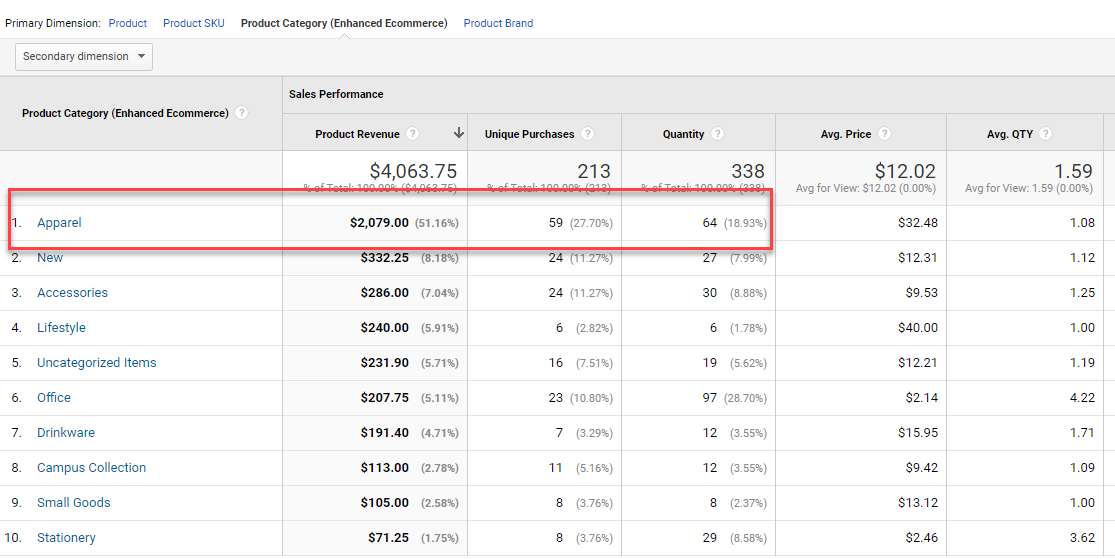
What product categories are most popular?
- This is another situation where you have to ask what you value most. Is it sheer dollar signs, or is it quantity of purchase? Again, sort by the metric you find most valuable.
- Here you can identify which categories of products are really pulling their weight, vs. areas that may need some love.
- In the example shown below, Google’s Merchandise Store has 51% of its revenue driven by Apparel in the month of July, while “Office” drove the highest Quantity of product sales.
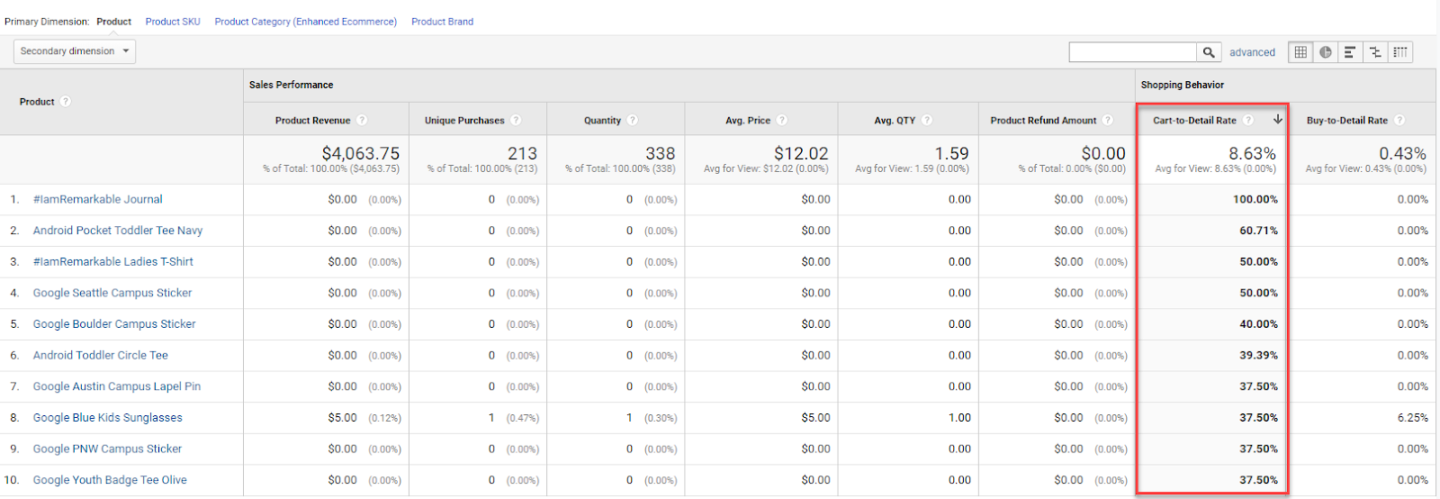
What products have the most cart-to-detail vs. buy-to-detail rate?
Cart-to-detail rate = product adds to cart / views of product details.
So, of people that looked at the details about your product, how many people liked what they saw enough to add them to cart? You can sort by “Cart-to-Detail” rate in your Enhanced Ecommerce reports to see which products are doing best in this respect.
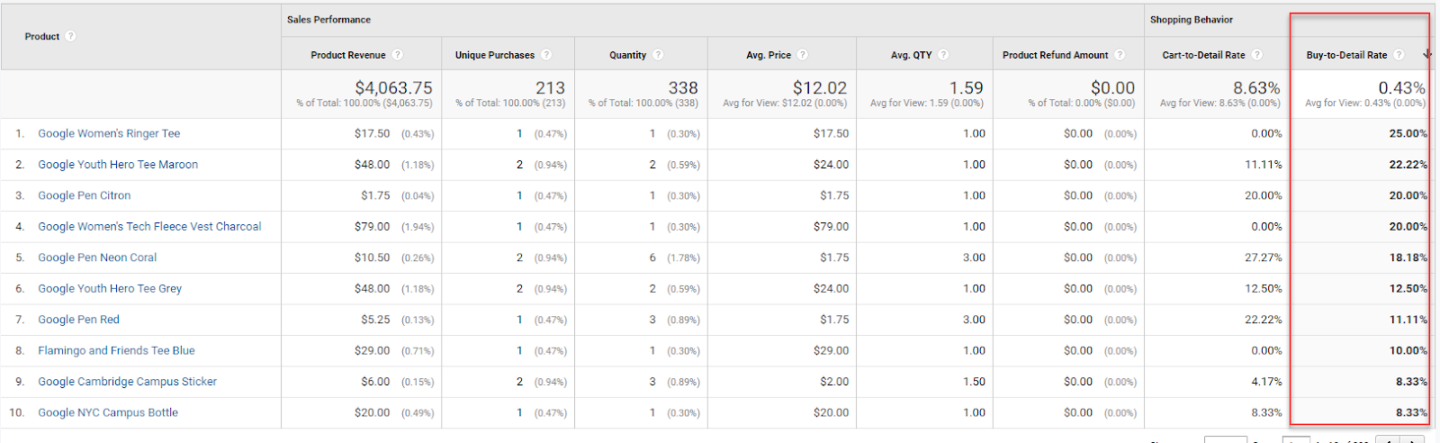
“Buy-to-Detail” is a similar concept.
“Buy-to-Detail” is the people who have actually bought your product / total views of your product detail pages.
What product searches have driven success?
There is an Ecommerce feature in the Site Search Report that shows some interesting insight into what people are searching and if these searches are actually making money.
While the Google Test Data doesn’t have much data in this report, the below report exemplifies where to toggle to Ecommerce in the Site Search report, and see how site search influences online purchases.
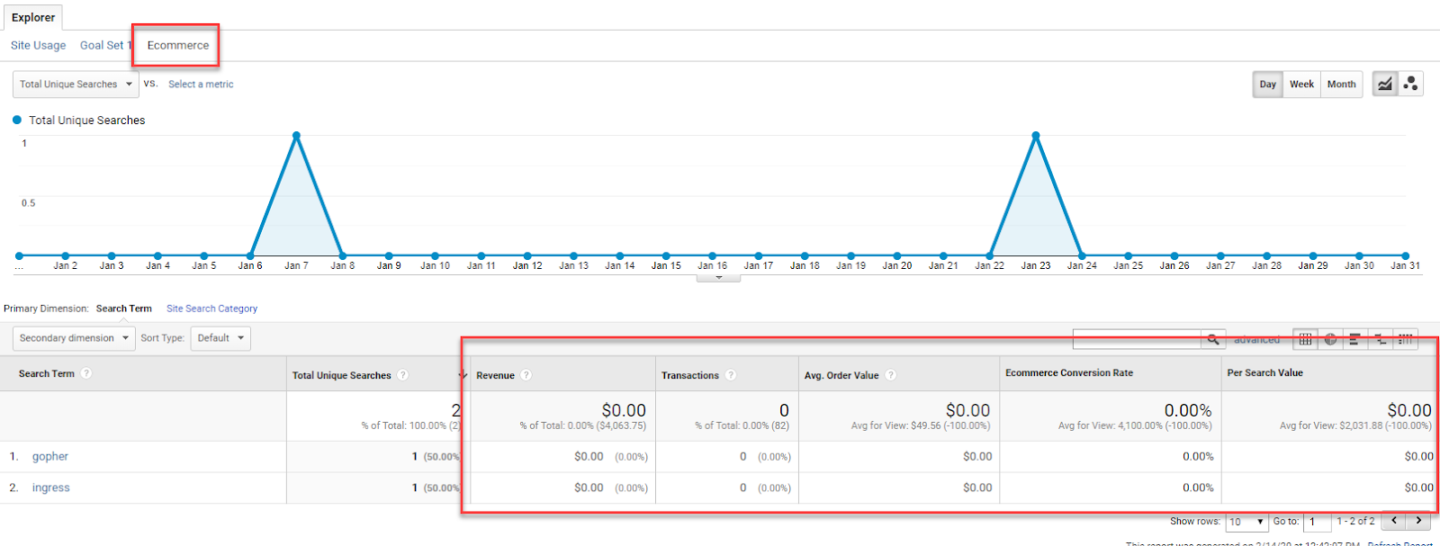
You can learn more about how to use site search data to inform Ecommerce optimizations here.
What does a particular Audience’s shopping behavior look like?
We talked above about how powerful Segments are in Enhanced Ecommerce. You can highlight a specific audience’s actions, and understand how they perform in your purchase funnel.
Below is an example of an audience of users that are only on Mobile and Tablet, and their Shopping Behavior Funnel.
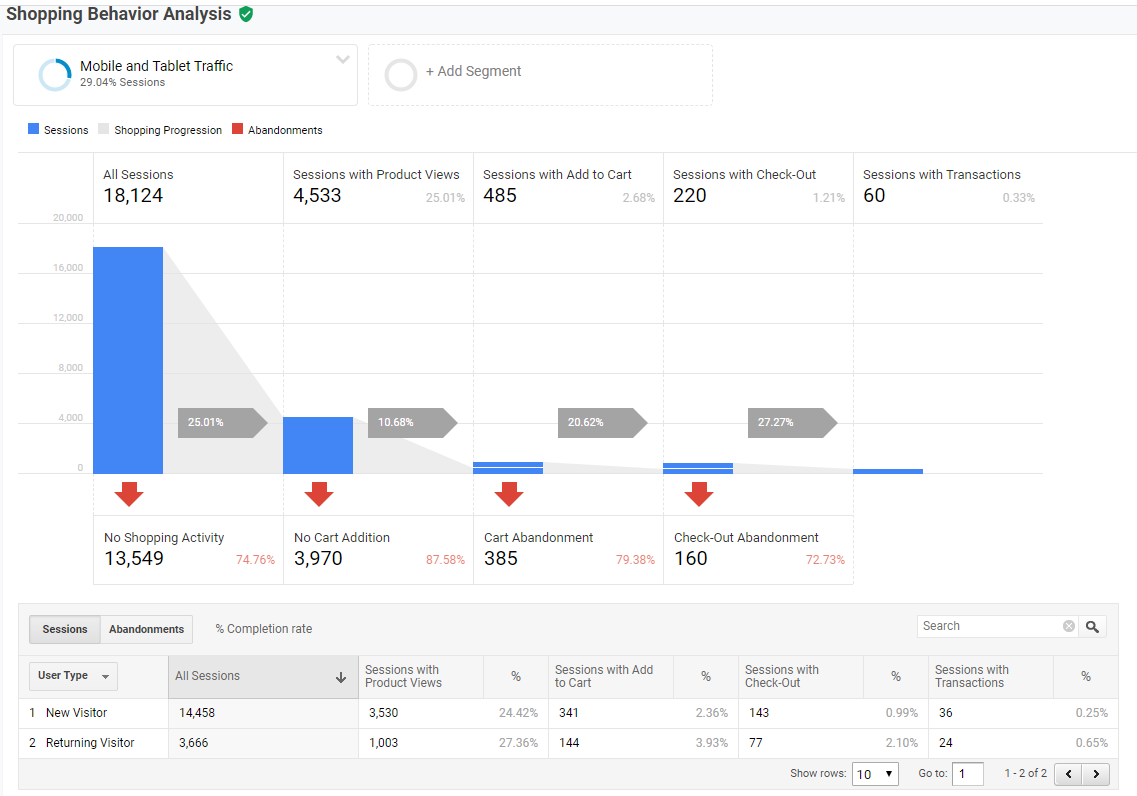
Here, you can identify dropoff points, and see how this compares to Desktop to see if users on a particular device are struggling at certain points of the buyer journey.
How do we identify marketing channels’ impact on Ecommerce?
Like we showed above, your acquisition reports have Ecommerce functionality (see below).
Use that to its fullest, and dig into your marketing channels and source / mediums to see what seems to be motivating people to buy.
Get Analyzing!
Enhanced Ecommerce opens up a whole box of analysis that will give you insight into your online buying behavior like never before.
Have any favorite “analysis starters” for analyzing Enhanced Ecommerce data? Drop ‘em into the comments below!
Sign up for our newsletter for more posts like this - delivered straight to your inbox!