Introduction to Google BigQuery
Technical Rundown
BigQuery is a columnar database, this is built using Google’s own Capacitor framework and features nested and repeated fields.
BigQuery databases can take a variety of data types as inputs and is a great fit for semi-structured data. Nested fields like totals (visits etc) and others are used to keep storing data affordable and fast. Similar databases are Redshift or Parquet.
Querying BigQuery can be done in either standard or legacy SQL depending on the flavor you prefer. To access your Google Cloud Console (where you run queries) follow this link.
Google BigQuery Tutorial & Examples
Running Queries
To get started running queries, I suggest using The Google BigQuery Cookbook, this is your one stop shop for questions, details, and samples to help you get more familiar. Please note the following data nuances:
- Tables are broken out by day meaning that you will need to use a wildcard, or * to pull a larger date range.
- There is also an “intraday” table that will give you data for the last 24 hours. This data is streaming an updating all of the time.

Visits over the last 36 months:
SELECT date, SUM(totals.visits) AS visits, SUM(totals.pageviews) AS pageviews, SUM(totals.transactions) AS transactions, SUM(totals.transactionRevenue)/1000000 AS revenue FROM `bigquery-public-data.google_analytics_sample.ga_sessions_*` WHERE _TABLE_SUFFIX BETWEEN FORMAT_DATE('%Y%m%d',DATE_SUB(CURRENT_DATE(), INTERVAL 36 MONTH)) AND FORMAT_DATE('%Y%m%d',DATE_SUB(CURRENT_DATE(), INTERVAL 1 DAY)) GROUP BY date ORDER BY date ASC
Transactions by device browser & type:
SELECT device.browser, SUM ( totals.transactions ) AS total_transactions FROM `bigquery-public-data.google_analytics_sample.ga_sessions_*` WHERE _TABLE_SUFFIX BETWEEN '20170701' AND '20170731' GROUP BY device.browser ORDER BY total_transactions DESC
Exploring Data
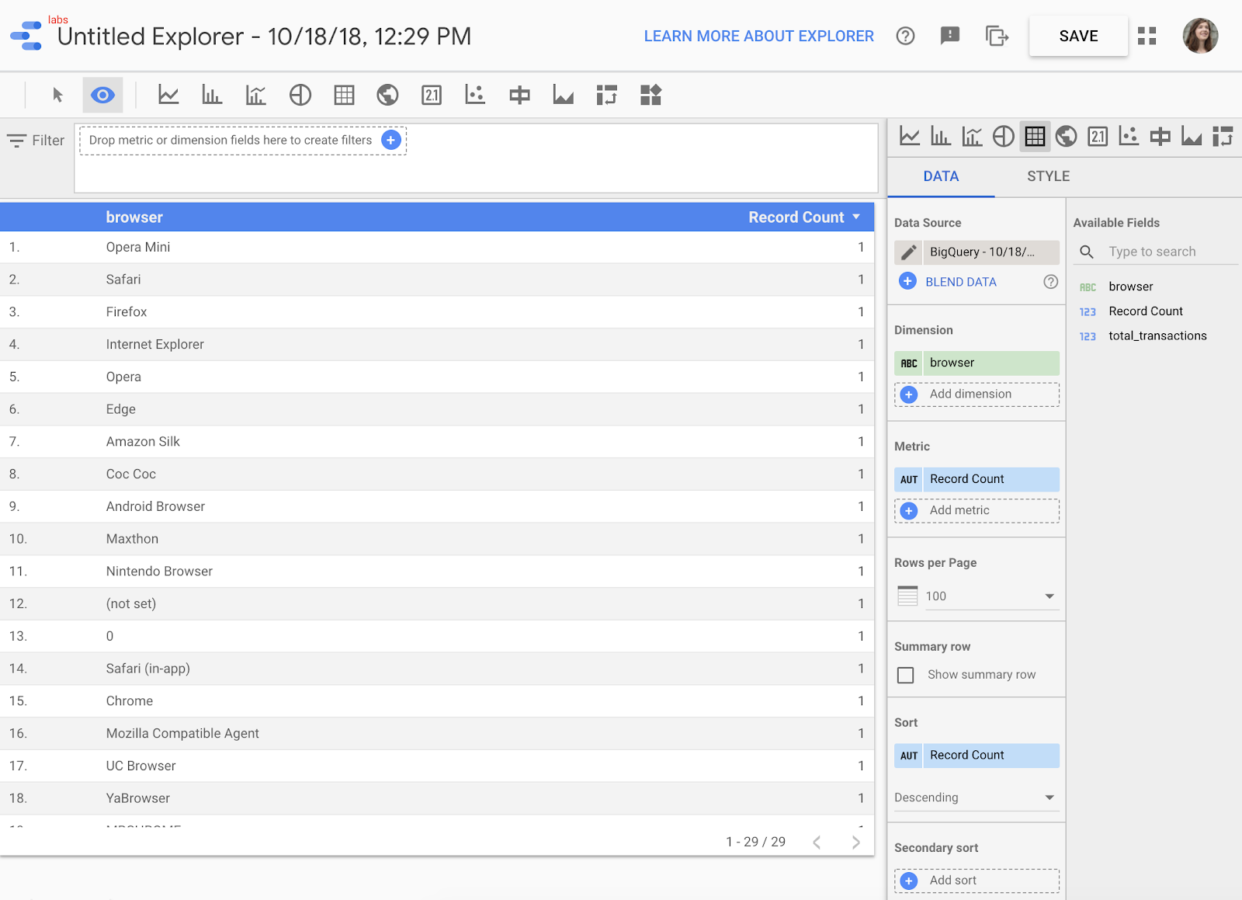
Now that you have successfully run a query or two, it is probably time to start analyzing! From the console, you can hit the “Explore in Data Studio” button that looks like this:
Google Data Studio Explorer Tool:
Exporting Data
If you’d like to save a query result use the button that says “Save Results”:
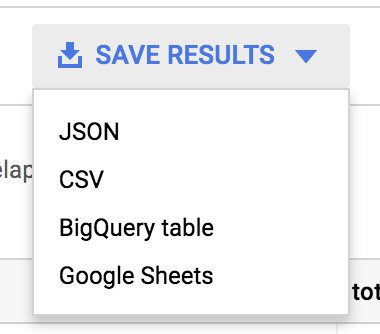
This will allow you to select from a variety of data outputs to make sharing and analysis easy. If you’d like to save the data as a SQL view, you can use the “Save View” feature.
![]()
Google BigQuery is a powerful tool that drives real business value by combining and storing data from a plethora of sources. With the easy-to-use interface, any standard SQL user can feel right at home with BigQuery’s capabilities. Want to learn more about the Google product suite? Start here.