We’ve all been there, you publish a blog, post it on social, and the likes and shares start rolling in. You lie back, admiring your lofty accomplishment, like Michelangelo in the Sistine Chapel. Checking Google Analytics a few weeks later, you are shocked to find that the flow of social media traffic has slowed, and to make matters worse, your post hasn’t gained any organic rankings.
What gives?
Optimizing posts that have performed well on social but not in organic search is a quick win opportunity because the topics have essentially been pre-vetted for interest within your audience. With the right tweaks, you can easily turn your one-trick-social ponies into SEO workhorses.
The factors that make successful social media posts are different than the success factors of organic search. When a blog post performs well on social media but doesn’t gain organic rankings, what does that tell you? Maybe the topic is inherently interesting and clickable, but the post is not optimized for SEO ranking factors. Perhaps your social media channel messaging and aesthetic are dialed in, but your website hinders the post’s organic visibility potential. Or in some cases, the topic might be overly trendy, or there might not be enough sustainable search demand, even though social signals indicated quick success.
No matter the case, the first priority is identifying the posts that have done well on social that you should take a closer look at from an organic perspective. The good news? This part is easy. After reading this post you will have a short list of your own blogs that have the highest opportunity for organic ranking improvements.
How to identify blog posts for optimization
The most important aspect of this analysis is determining the delta between social sessions and organic sessions, and prioritizing the posts that have received disproportionately higher social sessions. You also want to consider the length of time that a post has been live, as social sessions will spike immediately after posting, and organic rankings take weeks or months to build.
As you probably already know, Seer loves Power BI. I’m going to walk you through how to identify posts that are ripe for optimization using Power BI because it is an efficient tool for the job, but similar steps could be taken in other BI tools or even through simple spreadsheets.
Data sources
The only data source that you will need is Google Analytics. However, we will be applying some calculations, sorting, and visualizing our data, so you’ll need to use a BI tool or spreadsheet instead of the GA interface.
PowerBI makes this really easy with a native Google Analytics integration. Power BI will also continuously update your data, so there’s no need for additional data pulls after initial set up.
First, you need to connect Power BI to Google Analytics, then sign in to your Google Account.

Next, you will select the property and view that you will be using for analysis, then the specific metrics for the report. Select the following metrics:
- Date
- Default Channel Grouping
- Landing Page
- Sessions
Editing your data
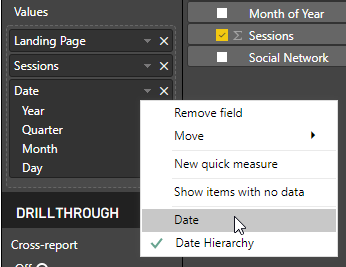
Once your data is loaded you will need to create a table. Select Landing Page, Sessions, and Date. Hit the drop down next to Date to toggle from ‘Date Hierarchy’ (default) to ‘Date’.
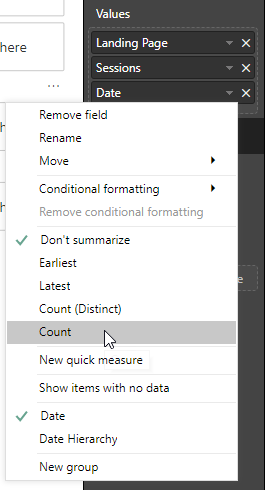
Next, switch Date from ‘Don’t summarize’ (default) to ‘Count’. This will now count the months that your post has been live. This is important because organic rankings take time, so you want to give more weight to posts that have been live for several months but still haven’t driven significant organic traffic.
Now that you have a table, it is time to run some calculations. The easiest way to identify posts that performed well on social, but not organically, is to calculate the session delta between the two channels. Put another way, subtract social sessions from organic sessions. A high negative number indicates a post that drove a large amount of social sessions, but comparatively few organic sessions. The highest negative numbers are the posts that are the most prime for optimization.
To calculate the delta, I used a Calculated Column within Power BI. To create a calculated column, click ‘Modeling’ in the top ribbon, then click ‘New Column’. This will open a formula bar under the ribbon at the top of your screen. Next, paste and adjust the following function to match the names of your data source:
Delta = CALCULATE(SUM('Name of data source'[Sessions]),'Name of data source'[Default Channel Grouping] = "Organic Search") - CALCULATE(SUM('Name of data source'[Sessions]), 'Name of data source'[Default Channel Grouping] = "Social")
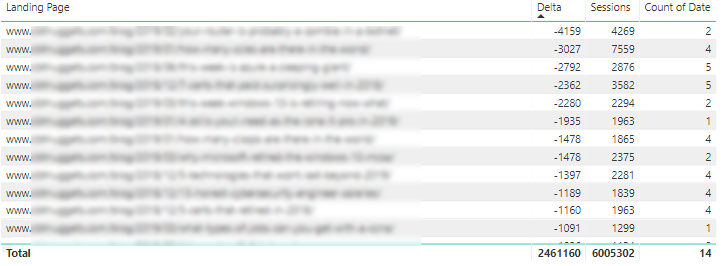
If the function executes properly, you should now have a new column labeled ‘Delta’ that subtracts social sessions from organic sessions. Sort this column so that the highest negative number is at the top. I also filtered my landing pages to only show blog URLs, because they are what I am most concerned with optimizing. You should now have a table that looks like this:
Visualize your data
Now that you can see the posts that performed well on social, but not organically, it is important to visualize the data to understand what is actually happening with each post.
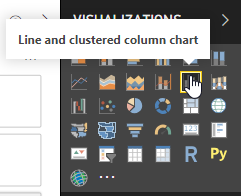
First, create a line and clustered column chart.
Configure your chart to display the following:
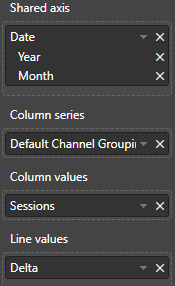
You will now have a chart that looks nice, but isn’t very helpful:
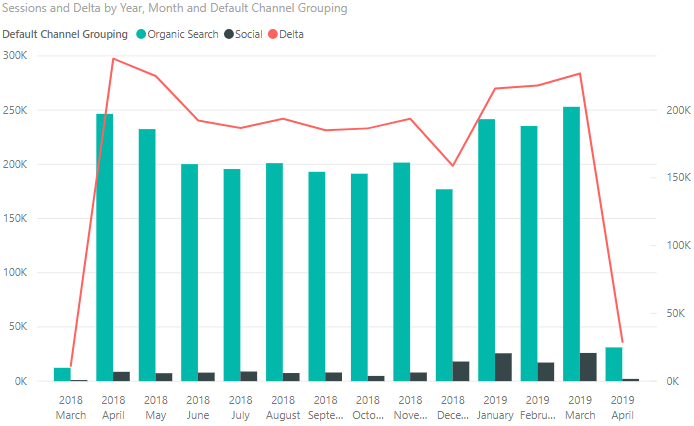
The data here is aggregated. The value of this chart appears when you click into individual landing pages within your table. Click around to the posts with the highest negative delta and a significant amount of months live to see how the visualization changes.
Analyze your data
Here is an example of a post that is ripe for optimization. The delta is -2,362 and the post has been live for 5 months:
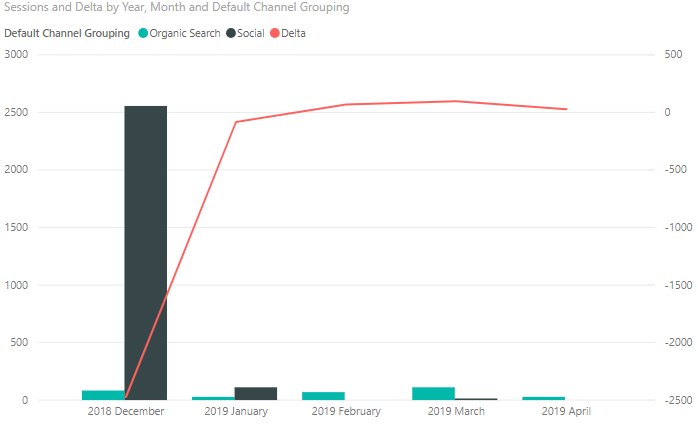
It is common to see a large initial spike in social traffic around publish, then a drop in social traffic in the coming months. Coupled with minimal organic traffic with no positive trend, this post is worth digging deeper into for optimization opportunities.
As you click around to different posts within your table, ask yourself, is the content of your post evergreen, and is it topically aligned with other posts that drive traffic to your site? If so, then you have found yourself a post that is ripe for optimization.
Optimize your posts
As you identify posts that are worth optimizing, you might ask yourself, “what’s next”? From here, you’ll want to run some keyword research around your topic, and also investigate keyword and conversion trends from your PPC data. It is also worth revisiting your original social posts that did well. Can you adopt your social headline as a title tag or meta description to entice clicks? Is there positive (or negative) feedback in the comments that you could use to supplement the post?
As you optimize your posts, Seer has extensive content strategy tips, tricks and walkthroughs to help you at every step along the way.
Happy optimizing!