
One of the greatest values of data visualization tools is being to connect different types of data tables to calculate results, illustrate trends, or discover outliers. Relationships between your tables are necessary to create these connections.
Relationships in Power BI
Relationships in Power BI have multiple configurations, including cardinality and cross-filter direction, which determine the way that your tables connect and interact with each other.
Cardinality
A one-to-one cardinality means that the related column in both tables has only one instance of each value.
One to One (*:1)

One of the most basic relationships is a one to one relationship. This occurs when there is only one instance of each unique value in two related tables. As you can see in the table above, these relationships are simple and match up nicely.
Many to One (*:1)
 A many-to-one relationship means that one column in one table has only one instance of each unique value, but the related column in the other table has multiple instances of a particular value.
Many to One (*:1) Using a Bridge

Many to Many (*:*)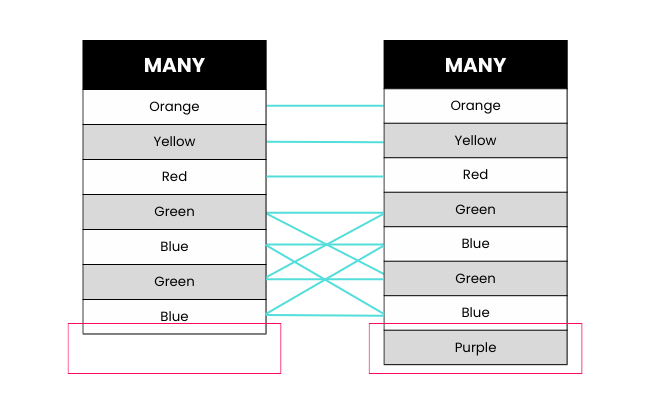
Power BI released a many-to-many relationship feature as part of the composite models capability in Power BI desktop. You can enable this by navigating to file > options & settings > options > preview features > and checking off composite models. You’ll need to restart Power BI after enabling composite models.

So…wouldn’t the ability to create a many-to-many relationship mean that there’s no need to build a bridge table?
Technically yes…but depending on how many data sources you’re connecting, how complex your data is, and other factors you might want to build a bridge to ensure accuracy in your relationships.
For example, many to many relationships usually fall short when all of the unique values don’t occur in each table. When looking at the example relationships above, you can see that the many to many relationship does not account for the color purple, since it is only found in one table. Where on the other hand, the relationship that uses a bridge does include purple as a unique value. This can affect overall analysis, explained in the example charts below:
Analyzing Data With a Many to Many Relationship

You’ll notice that the analysis in this chart doesn’t include the value Purple. However, we know that it is present in at least one of the tables from our example above. As previously mentioned, many to many relationships frequently miss data points that are not found in all of the tables being used.
Analyzing Data Using a Bridged Relationship

On the other hand, when using a bridge, all unique values are accounted for in your analysis. This ensures that you are not potentially missing a large piece of data that can significantly impact your results.
Cross filter directions
When creating a relationship you can choose between a single cross-filter direction or a both cross-filter direction. With both cross filter direction, when you filter any values in one table, the same filter will apply to values in the other table if they are connected by a relationship—treating all aspects of connected tables as if they are a single table.
Building a bridge table
A bridge table—also known as an associative entity table—is a way to create a many-to-many join by creating a table with a column that contains a singular instance of each unique value, which creates a bridge to join two or more many columns together.
Step 1: Clean your data
I can’t stress enough how important cleaning your data is before building a bridge.
If you take the time to clean your original tables, by the time we create references in the next step, your references will be clean because you already cleaned your data. It saves time to just clean everything first then to have to go back and try cleaning multiple tables after you’ve made transformations and references.
Anyway, how do you expect to properly connect your data if you have mixed case URLs in one table and not the other? If some URLs have trailing slashes and some don’t? Maybe your values from one table have whitespace at the end and you’d have no idea!
If you don’t clean your data, then you won’t have a trustworthy output. You’ll spend time building a beautiful dashboard that doesn’t actually tell you anything because the data isn’t connected properly.
So, before we go onto building a bridge, clean your data. See our checklist for cleaning URLs and our post on cleaning and deduping your data in Power BI to make sure your tables are prepped before moving on to Step 2.
Remember that you won’t need to de-duplicate any of your data for this tutorial since we’ll be building a de-duplicated table to bridge your other tables.
In this example, I’m going to compare our conversions from paid search terms vs. rankings for organic keywords to find opportunities to optimize organic pages and augment paid spend.
Step 2: Create references of the tables you’re bridging

Create a reference of each table that you would like to bridge by right-clicking the query and selecting reference from the dropdown. (In my example, I’ll be creating a reference of my Adwords table and my organic rankings table).
Why a reference and not a duplicate? A query reference will only refer the result of the query, whereas a duplicate will duplicate the code of the query, creating a new object in the memory.
Step 3: Remove other columns
Now that you’ve created references of both tables, you can remove all other columns in the reference queries except the columns you will be bridging. (In this case, the keyword column in the reference to the organic rankings query and the search term column in the Adwords reference query).
Right-click the column you want to keep and select remove other columns from the dropdown menu.

Your reference queries should now only have one column each—the columns that will be combined into a bridge.
Step 4: Update all column headers to the same value
The next step is to ensure that the single column in your reference table has the same header value. Our following step is combining all of the tables together. And if your columns have different headers, Power BI will assume they are completely separate columns. This is case-sensitive!
For example, I’m going to update my “search term” column to “keyword” to match my organic rankings query. You can do this by double-clicking the header and changing the value.
Step 4: Append all references to the bridge table
Now you’re going to choose which reference query will become your bridge. It doesn’t matter which one you choose, but I like to rename it to bridge to make things easy.

While your bridge query is selected, you will then select append queries in the top right of the home section in the query editor.
In the append window, select whether you’ll be appending two tables or 3+ tables—in this example we’re only appending two tables—and select the references that you’re appending. References will all have a (2) after the query name unless you renamed them.

If you did everything right you should still only see a single column in your bridge table. If you didn’t properly rename your headers you’ll have multiple columns in your bridge.
Step 5: De-duplicate your bridge
Next we’ll want to deduplicate our bridge of combined keywords and search terms by selecting remove rows > remove errors, remove blank rows, remove duplicates.

You can also right-click on the reference query that did not become your bridge and deselect enable load. This removes the reference table from the query results that are available for report builder. (You won’t need this since all your data is in your bridge).
You can close out of the query editor and apply changes.

Step 6: Create a relationship between your bridge and data tables
The next step is to create a relationship between your tables and your bridge. Select manage relationships—depending on how you named your headers, you may already see that Power BI is trying to recognize connections between tables and has already created some relationships.

If you see some already-created relationships from Power BI’s autodetect, make sure you click and edit the cross-filter direction if needed since it will automatically be set to single.

To create a new relationship, select new and then highlight the columns in each table that we should be matching. Cardinality should be many to one (*:1), since the search term column has many values and the bridge keyword column should have a single, unique value to join.

You can also view and create relationships in the relationship pane. A double-sided arrow indicates a “both” cross-filter direction for quick QA.

Now you’re ready to build your dashboard with connected data!
When using a bridge, make sure that you use the bridge column value whenever applicable (instead of data from one of the tables), since your bridge table should contain one of all values from all of the many tables.
For example, when I build out my scatter plot to compare paid conversions to organic rankings, I’ll be pulling the keyword column from my bridge table.

We’re done! We’ve created a relationship between our paid search terms and organic keywords. Now we can analyze which terms are converting and start to dig into how we’re ranking for the related organic keyword, then find opportunities to optimize/create content.
Found this tutorial helpful? Subscribe for more Power BI tips and tricks: