In the world of digital analytics, automation is one the biggest keys to ensuring you obtain maximum value from how and where you spend your time.
Automation is the mindset of spending time upfront to save you time in the future.
This could save hundreds or thousands of hours if done correctly. With this time, you will be free to do valuable, actionable analysis, make digestible visualizations of your data, tell compelling, helpful stories with the data that you find and drive bottom-line value for your business.
When it comes to Adobe Analytics, if you want to make your work easier and automate recurring and complex tasks, there is an available solution: Adobe Report Builder.
Adobe Report Builder is an Excel add-in that allows you to pull your Adobe data directly into Excel. In many ways, Adobe Report Builder mirrors the approach of the Google Analytics Sheet Add-On, only with Adobe data, and Excel switched out for Google Sheets.
In this post, you'll learn the ins and outs of working with the Adobe Report Builder. Here's what elements of the Adobe Report Builder we'll cover:
- Prior to Report Builder Installation: Automation Tips
- How to Install Report Builder and Log In
- Using Report Builder
- Helpful Tips
READ OUR beginner’s guide to adobe analytics
Prior to Report Builder Installation: Automation Tips
Regardless of how you are automating data, I highly recommend the following steps:
Step 1: Ensure that report automation is used for tasks that are: repeatable & recurring
Monthly reporting is a great example, complex pulls (say five dimensions with 10,000 rows), or even better, both! You’ll get the most value out of your automation by setting it up in this manner. If you have one-time tasks, I recommend Adobe Analysis Workspace as your best option.
learN HOW TO USE the adobe analysis workspace
Step 2: Whenever automating, it can help to first lay out a sheet of exactly what you want to pull
Note the reports you’ll pull data from, the dimensions, metrics, date range, granularity, segments you’ll need, any filters and desired sorts, report scheduling cadence, etc. Having this prior will give you a clear picture of how you want to structure your data as your guide.
Step 3: I highly recommend having three layers (or Excel sheets) for automation
- Your initial Report Builder pulls of data
- A central sheet where this data is then organized for easy consumption
- A dashboard sheet where your data is displayed (ideally with a mix of visualizations and tables).
Cell references (which you can bulk switch out using find + replace) are your best friend here, too! This three-tier structure allows you to easily troubleshoot if you have issues. Now that you have the automation tips you need, let’s get Report Builder installed in your computer!
How to Install Report Builder and Log In
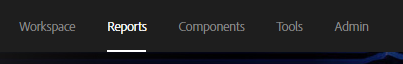
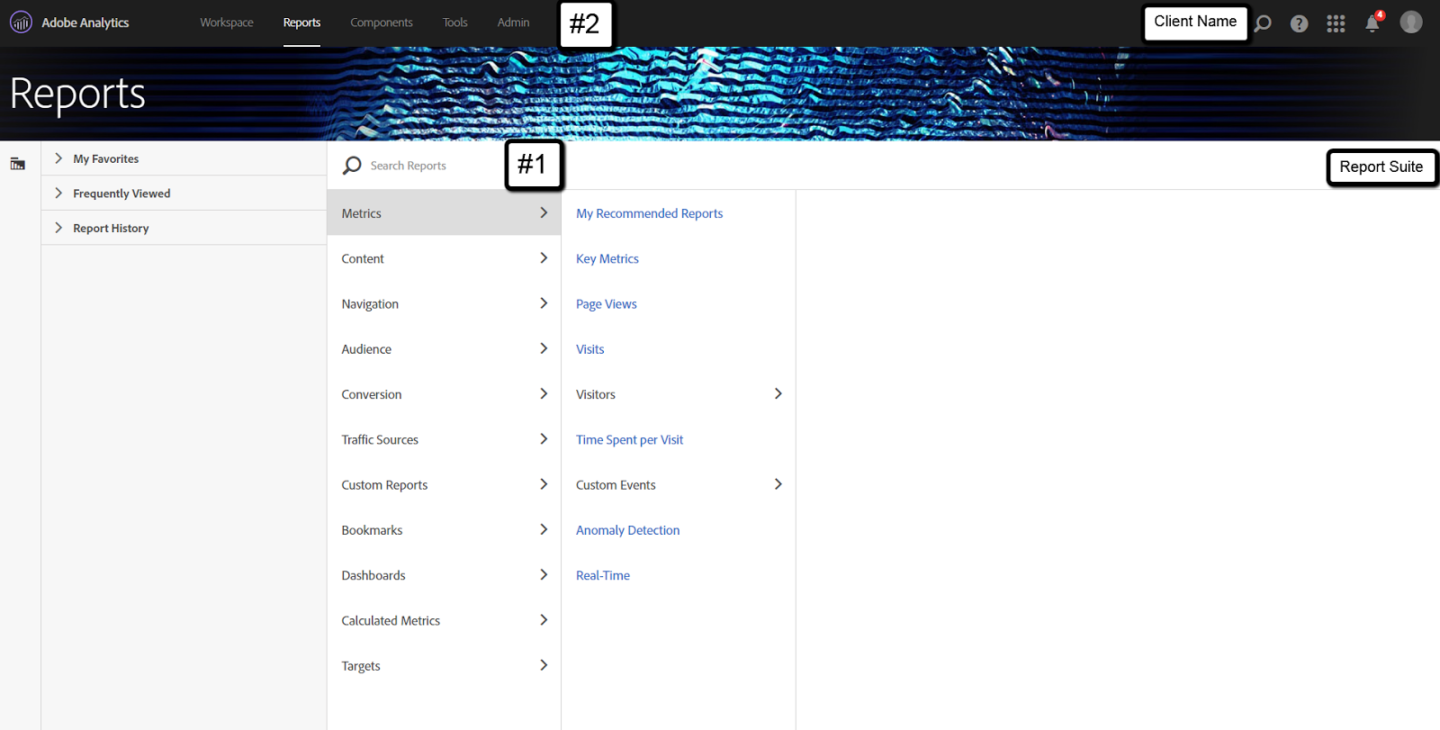
Access to Report Builder is granted at the user level of access in Adobe Analytics. If you have it, you’ll see Report Builder under the Tools drop-down on the top navigation of Adobe Analytics:
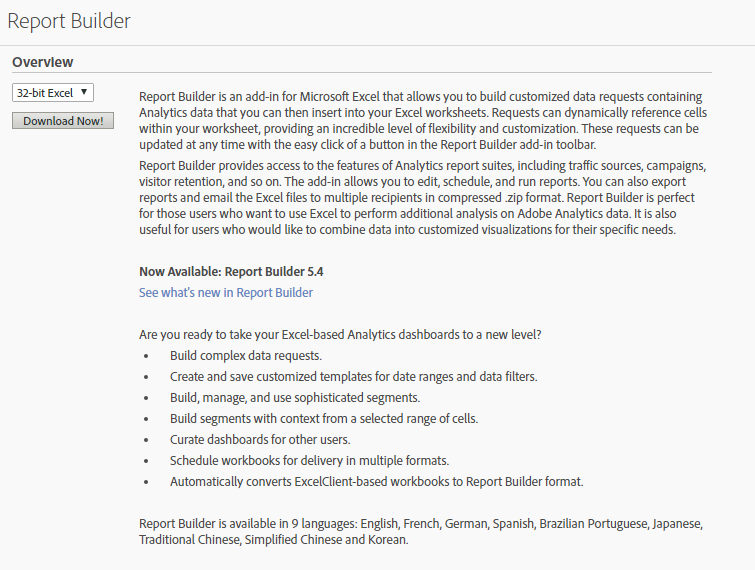
If you don’t see it, ask your Adobe administrator for access. Be aware that you may have limited Report Builder licenses. Once you reach the Report Builder area, select your 32 or 64-bit, and download!
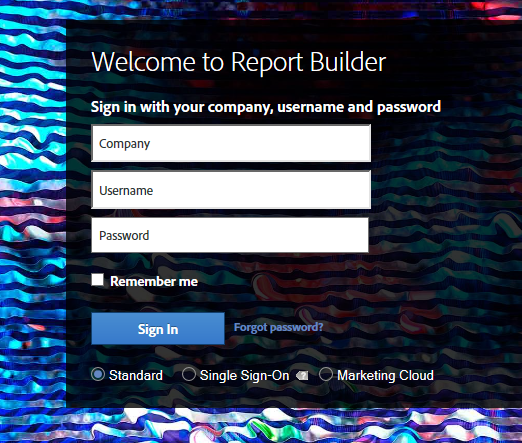
Once you get through the installation process, when you open Excel, you’ll then see the following option:

Signing in with your basic Adobe credentials will give you the access you need.
If you open a worksheet that already has Report Builder pulls set-up, you will be prompted to log in from the start.
Now that you are logged in, let’s walk through your Report Builder options one at a time, and get some pulls set up!
Using the Adobe Report Builder
Report Builder offers a few main options, which we will walk through individually below:
- Sign In (already covered)
- Create
- Manage
- Refresh
- Schedule
- Library
- Options
- Unlocked/Locked
- Help
Creating a Report Builder Pull
A Report Builder pull (Adobe referrers to these as “requests”) is the simplest interaction to set-up automation. Let’s do a basic one. Upon hitting create, I’m prompted with a the request wizard:
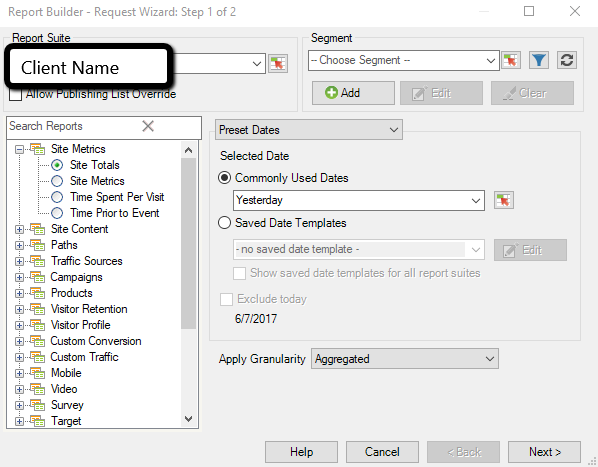
Items to select:
- Report Suite: What report suite are you pulling data from? You can only use one report suite per pull.
- Segments: Add as many segments as desired to your pull. If you use multiple segments, Adobe finds the overlap between these segments in your pull (i.e., using mobile and natural search segments will find users who are mobile and natural search).
- Search Reports: This is where you will select the report you pull from. This corresponds with your report overview in Adobe. See below:
- Date Selection: What are you looking to pull in terms of dates? Use Adobe’s presets, such as Last Month, Last 6 Months, etc., to make your life easier! You can also put custom data ranges in Excel cells and reference them for ease of use.
- Granularity Selection: Do you want a single number (aggregated), or does this need to be broken out by month, quarter, day, hour (could lag), etc.?
For our example, I’m going to pull organic traffic for the last month. Once I hit next in the report wizard, I get step No. 2:
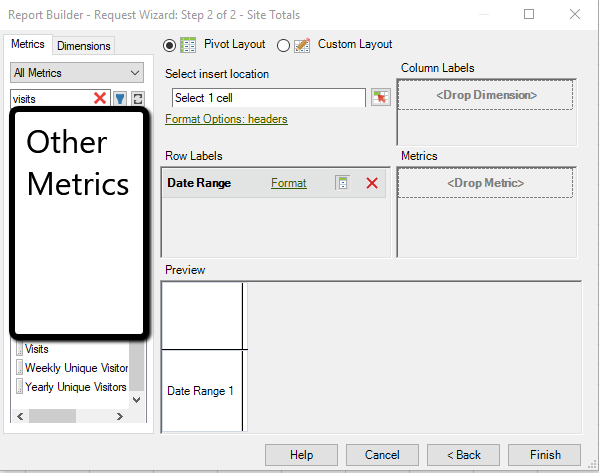
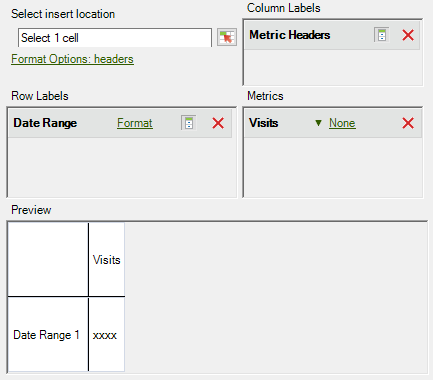
Search for, drag and drop the metrics and dimensions you want to the corresponding areas. By dragging visits to Metrics, I get an updated view of what the pull will look like:
If I hit finish in the bottom-right corner, this then prompts me for where I want the data to go in my heet:
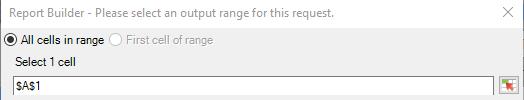
Where you put your data is critically important. For simplicity (and so it doesn’t break), data placement should not overlap with additional pulls (although Adobe typically notes conflicts for this) or be changed over time, especially if you are referencing it to display it elsewhere.
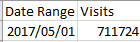
Once I select this cell and enter, the pull begins, and I get my output:
This is an extremely simple variation of a pull, but you can get very complex with nearly unlimited dimensions, metrics, segments, and granularities. Go experiment. Ask yourself: What is the most valuable way to pull this data?
Managing Your Report Builder Pulls
Now that you’ve set up your pulls, you can manage all of them at once. Let’s go through some key elements of this. If I go into a preset Report Builder sheet I have, and I hit Manage under add-ins, I’ll see all 28 pulls that I have:
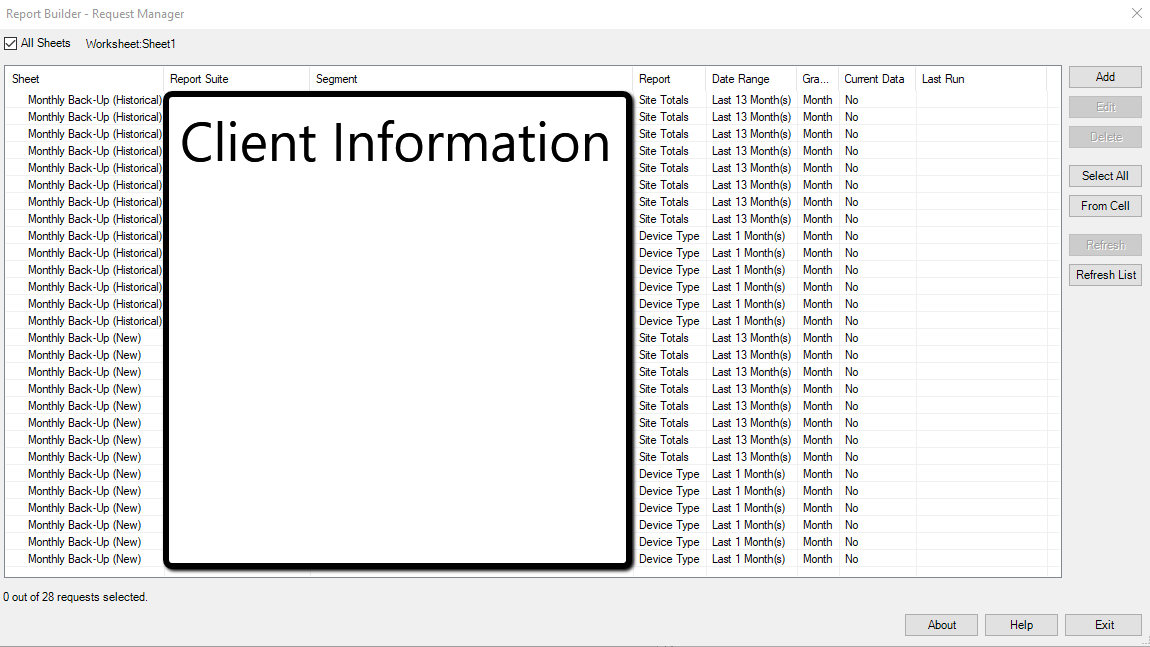
The top-level columns are:
- The sheet where the Report Builder pull lives in Excel
- Report Suite where the data pulls from
- Segments used in the pull
- Overall report selected
- Date range for the pull
- Granularity of the pull
- Is the data current (include recent, often unprocessed Adobe data, available only in its most raw form, still some delays)?
- When was the report last run (with the workbook open)?
What can you do from this view?
- Toggle between sheets of pulls in the top left (this group of pulls has two separate sheets with two separate report suites)
- Add/edit/delete individual or bulk pulls (more on this soon!)
- Select all pulls
- Refresh pulls directly
What issues can this view solve?
What if you wanted to switch out a segment in every single pull? Selecting all pulls and hitting edit multiple let’s you do this!
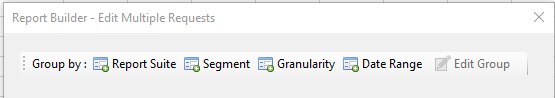
Group by segment, select the group, hit edit multiple, and change it. Bam, all your pulls are updated. You could have a single template and switch out by segments to create multiple automated reports. Imagine the time you could save by scaling this approach!
Refreshing & Scheduling Your Report Builder Pulls
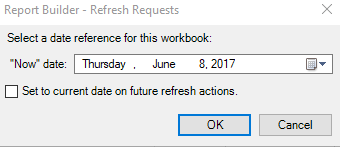
Adobe Report Builder pulls are available at all times to be refreshed. It will prompt you to select a “Now” date (critical for template data ranges such as “Last Month”), and then reports will run:
Refreshing large sets of requests can take upwards of 10 or more minutes depending on how detailed your asks are (and also if you have dependencies set-up, like one request that relies on data from another request to run).
This is where scheduling reports comes in! If I hit schedule under add-ins, I get the Scheduled Task Manager:
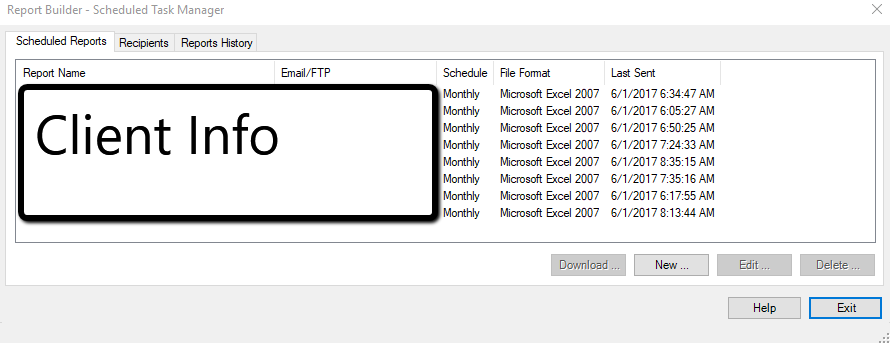
This let’s me see what reports I have set-up to run on a schedule, and if they successfully ran. By default, Adobe allocates 10 scheduled reports to each user, but this can be raised through admin settings.
However, let’s assume you had no reports scheduled and want to create a new one. Hit the “New” button on the bottom-right of the Scheduled Task Manager, and let’s create one.
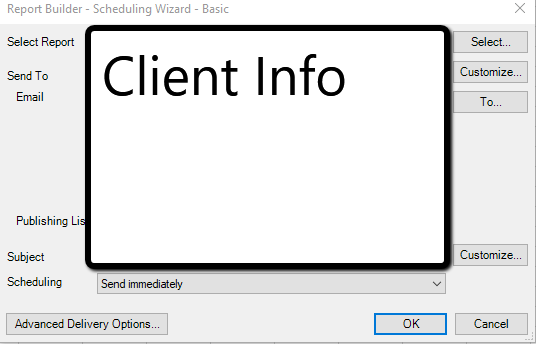
The report will most often be the report you are currently in. You pick the email you want to send it to and the subject to send (can customize based on the date range covered). Pro-tip: If you are scheduling multiple reports, set-up an email filter for these messages.
The real fun starts with Advanced Delivery Options (bottom-left). Let’s check it out:
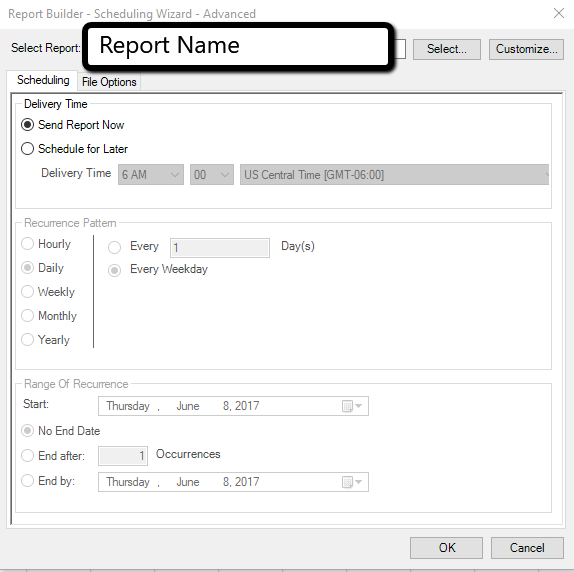
You can pick the exact time you want your report to run, how often it should recur (with great detail) and how long this recurrence should last. Under “File Options”, you get even more items to use:
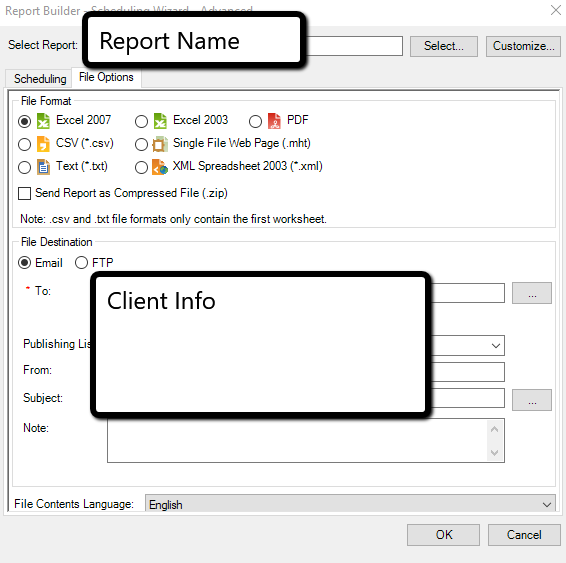
Want a PDF instead of an Excel file? Want to send to an FTP server instead of email? Go for it! In my opinion, Adobe Report Builder automation isn’t truly being used to its full potential without scheduling of reports.
Report Builder Library
Want to collaborate with others on Report Builder, but can’t share files between email or Google Drive? The workbook library affords you the ability to upload your own workbook and download those that others are working on:
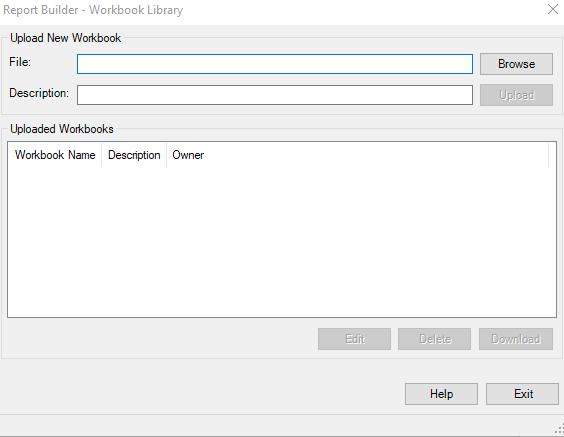
I honestly haven’t used this feature much, but I could see it being useful for certain organizations.
Report Builder Options
This offers a few custom settings for Report Builder, and I’ll walk through my favorites:
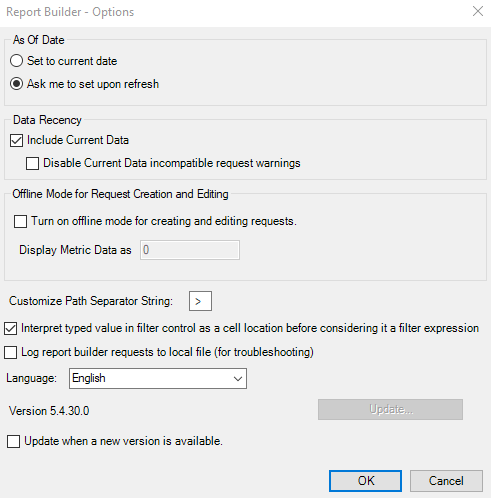
- Don’t want the be asked about the date for each request? Set to current date automatically.
- Offline mode is helpful inherently because Report Builder can be slow (each request has to initiate with the Adobe Analytics API, which can take some time), so if you want to quickly create requests, go offline and come back online when you need to refresh.
- Adobe pathing is great, and by default these reports use “>” to separate path steps. Want something different? Change it. This string is critical if you want to pull Adobe pathing information, and then use Excel text-to-columns to further analyze data.
Report Builder Locking
This is a simple toggle as a security precaution. If you have a workbook that you don’t want to be changed, lock it. Then, only admins or the user who locked the workbook can unlock it. Locking a workbook automatically puts it in offline mode, and does not allow you to create further requests. You can still refresh a workbook that is locked, however.
Report Builder Help
This launches Adobe’s tutorial information which could aid to answer questions that you have, and gives you access to recent updates to the tool, and Adobe’s community information.
Helpful Tips
A few things I’ve noticed in my time using Adobe Report Builder:
- Requests can fail. What’s important is figuring out why it failed. It could be a simple failure of the API itself, or you could not have access to the metrics/dimensions that you are requesting. Unfortunately, if one request fails, all subsequent requests are then cancelled. Typically, what I’ll do in this case is select all non-failed, non-run requests, run those first, and then troubleshoot the failed request(s).
- If you have a sheet with tons of requests set-up, simply right-click anywhere on the sheet in Excel and you can copy all requests (and the settings of those requests) onto another sheet. One you hit copy requests, right click again, hit paste requests and these requests will then be duplicated on a new sheet. I’ve found this incredibly useful when switching between multiple report suites in Report Builder and aggregating this data.
- Adobe Report Builder login is set at the user-level, so if you don’t have access to specified report suites or segments, you’ll need to get access to be able to use these features.
- Date automation is critical for these recurring tasks. Adobe presets are great, but if they aren’t getting it done for you, you have the ability to create your own date ranges, custom to exactly what you need. Enter Adobe customized expressions, reliant on Adobe’s date abbreviations.
Adobe Report Builder is an extremely powerful automation and data pulling tool, and it is easiest to learn by jumping in and exploring on your own. What cool data pulls have you done with Adobe Report Builder? What issues have you run into?
Let me know in the comments, and remember that automation gives you back an extremely valuable asset for a digital analyst: more time. Don’t waste it!