Geo Analysis Visuals in Google Data Studio
When we think about Geo Analysis in search typically we’d be thinking of PPC Geo targeting, but theres a lot of information we can glean regarding our SEO efforts from performing a Geo analysis.
In this post I’ll walk through 2 visuals you can build within Google Data Studio to better understand where your organic users are coming from, and what we can do with that information.
Which Cities, States, or Metros are generating sessions and conversions?
What does this visual look like?
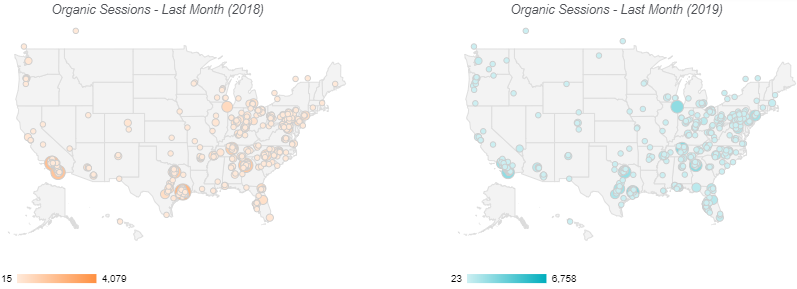
Sessions by City
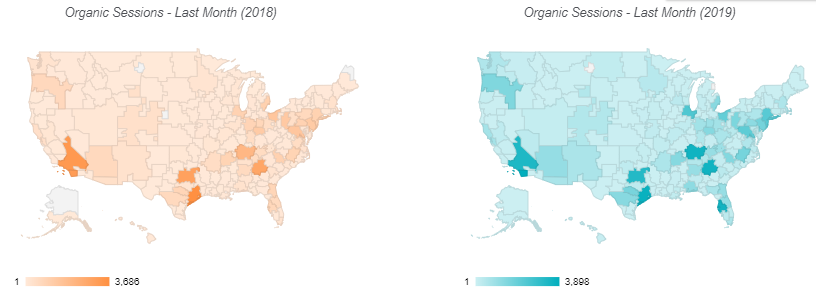
Sessions by Metro
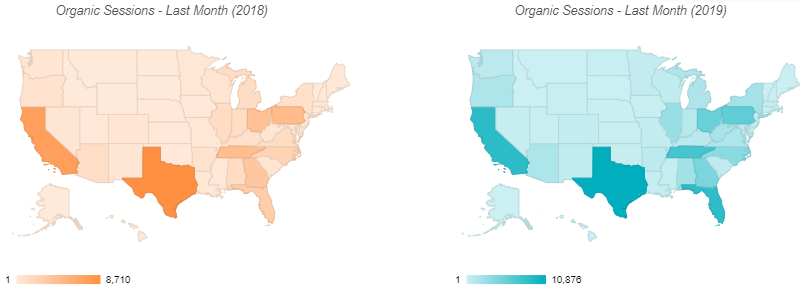
Session by Region (State)
- How do you build this visual?
- In Google Data Studio Select Add a Chart
- Move down the drop down and select Geo Map
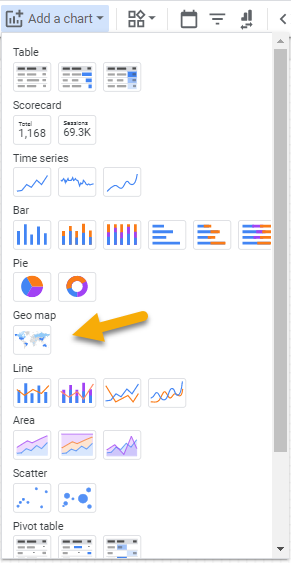
- Choose your preferred dimension under the dimension category (Region, City, Metro)

- Choose your preferred zoom level (for the purposes of this analysis we’ll be using United States but this zoom area can be changed all the way from Continent to City. (You’ll find United States under the Country Drop Down)


- Choose the metric you want to explore by Geo. For this analysis we’ll be examining sessions and goal completions
- Set a preferred timeframe (I typically use a months worth of data so that we have a statistically significant amount of information and so that we can see how performance has changed MoM and YoY).
How can we utilize this visual?
- Now that we have a Geo Map we’ll be able to see which exact States, Cities, and Metros are driving the largest amount of traffic and conversions each month. Toggle between different channels I.e (Direct, Organic, PPC, etc) to see if specific areas drive more or less sessions and conversions based on the user base.
- Experiment with using this visualization as a way to measure offline marketing efforts. If you’re running advertising campaigns in a specific state, sent direct mail to a specific city, or even placed a billboard in a highly populated interstate, see if you can find a YoY or MoM increase in Direct or Organic traffic & conversions in these specific areas.
What Channels are driving traffic your location pages?
(Note: This visual requires you to have dedicated local landing pages with a unique and filterable URL structure. Think website.com/state/city)
What does this visual look like?
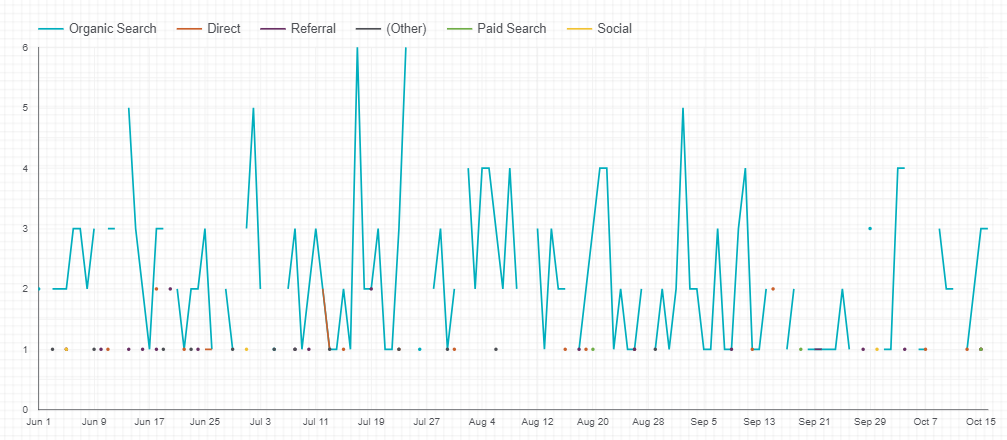
Sessions to local landing pages by Channel Grouping
- How do you build this visual?
- Before you begin, ensure that you’re using a data source that has not been filtered to one specific channel grouping
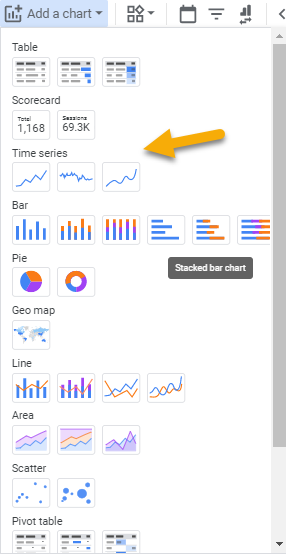
- In Google Data Studio Select Add a Chart
- Move down the drop-down and select Time Series
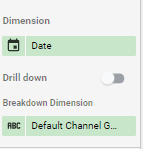
- Set your dimension to Date and your breakdown dimension to Default Channel Grouping
- Choose the metric you want to explore by Geo. For this analysis we’ll be examining sessions and goal completions
- Create a filter that will allow you to pull in target local landing pages. This will depend on your domains URL structure (i.e /state/city/)

How can you utilize this visualization?
- Now that we have a Geo Map we have another way to see how local landing pages are being impacted across all of our marketing channels. Use this view to see how marketing channels trended throughout the month.
- Is there a PPC Campaign running targeting local pages? See if its spiking throughout the month while the campaign is running. Did your team make SEO specific optimizations to local landing pages? Measure how those optimizations may be impacting the site at the macro level and determine which channels drive the most traffic to local landing pages.
- Want to get more specific? Build a landing page filter and toggle between each of your different local landing pages are impacted by your various marketing channels.
What’s Next?
If you’re interested in learning more about GEO analysis check out Seer’s Guide to Google Data Studio.


.png)