With coronavirus’ spread increasing, it is truly having an impact on multiple facets of life for people, and digital analytics is no exception. With this post, I’ll give you a few examples of quick tips you can use to ensure your data is as accurate as possible, and you are well prepared to maintain an accurate view of your data at this time.
If you are more interested in the impact on search (SEO/PPC), check out Seer’s blog post here.
Quick Tip #1 - Regional Benchmarking
As the situation continues to shift, an important thing to keep an eye on is any type of regional impact. We would naturally expect any type of international targeting, or regional data to shift along with the situation.
Given this, it’s important to be cognizant of:
- The most important regional areas for your business
- What current targeting you have set regionally
- Keeping an eye on regional data to see any notable traffic, engagement and conversion shifts
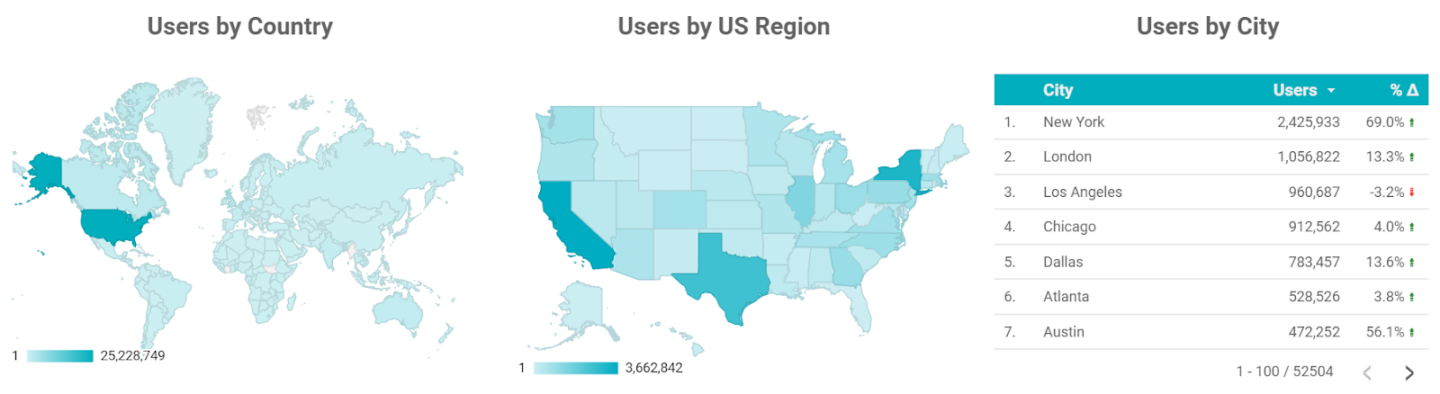
Using a data visualization tool like Data Studio, you could easily set-up some regional data visualizations to benchmark country, region, and city data at a period over period, and year over year perspective.
Theoretically, you could also use custom dimensions to send a “coronavirus location-based status” custom dimension based on regional-data for the user’s session, but this would require some type of tool in look-up location information in Google Tag Manager, so this is mainly an idea in theory right now.
Takeaway: Set-up a quick system to begin benchmarking your regional data depending on how the status of the situation shifts.
Quick Tip #2 - In-Person Event-Based Benchmarking
Coronavirus is forcing companies to cancel events all over the country, and perhaps even 2020’s Olympics.
So, if your company has had to cancel events in a similar fashion, what can you do to estimate impact?
The best way to be able to measure the impact would be if you have historical data if this event was run in the past (this assumes that the event is recurring, perhaps on an annual or quarterly basis, and not a one-off event). Given this, the best bet if you have this historical data would be to:
- Pull the full historical data for as many years as possible based on traffic, engagement and conversion/revenue/etc.
- Average out this information, unless more recent years are a truer projected picture of the cancelled 2020 event.
- Use this information to estimate the projected loss of traffic, engagement, conversions/revenue based on the impact.
If you historically haven’t had a good benchmark of in-person event data, ensure you are set-up to properly measure this data in the first place.
Takeaway: If you’ve had an event canceled, or think you may - use this data to have a clear view of the impact (or potential) on your data.
Quick Tip #3 - Increased Work from Home = Update Your IP Filters!
As work from home becomes more prominent given precautions and potential isolation, it’s important to maintain an accurate view of your data, and update your IP-based filters (also recommended as a result of Google Analytics' recent service provider change).
This will ensure that you have the most accurate view of your data possible. If your colleagues (or vendors you work with!) aren’t sure how to find their home IP address, they can simply visit this site to provide you with their IP address.
Takeaway: IP-based filtering in Google Analytics views is always recommended. The current location-based situation of the coronavirus will inherently become more unpredictable as the location of users working shifts.
Recap: Quick Tips 1-3
To again emphasize, this is a quickly shifting situation, but as some immediate next steps, you can:
- Benchmark your regional data
- Benchmark any impact against cancelled events
- Set-up additional work from home based IP filters for your data
These three steps will put you in an improved situation to have cleaner data and a better view of the current impact of coronavirus on your digital analytics overall.
If you have any additional thoughts or questions, please feel free to add them below.
Sign up for our newsletter for more posts like this - delivered straight to your inbox!

.png)