Advanced Analysis is a new tool in beta for Analytics 360 customers. This interface allows you to more deeply understand how segmented audiences interact with your site, and how to leverage that insight to better guide customers through your marketing funnels.
There are 3 new powerful tools found within Advanced Analysis to help you surface insights from your data: Exploration, Funnel Analysis and Segment Overlap.
In the next few sections, we’ll go over how each technique can be utilized in a way that drives real value for your business, clients, or partners.
⛔️ Are you or your company a Google Analytics 360 customer? Advanced Analysis is a new tool in beta for Analytics 360 users only. Learn more about the benefits of GA 360 here. ⛔️
Creating Visualizations in Advanced Analysis
Navigate to Advanced Analysis either by clicking the Analysis tab on the Google Analytics navigation pane, or by going directly to analytics.google.com/analytics/web/. From there you’ll have a list of reports that you own, or that are shared with you.
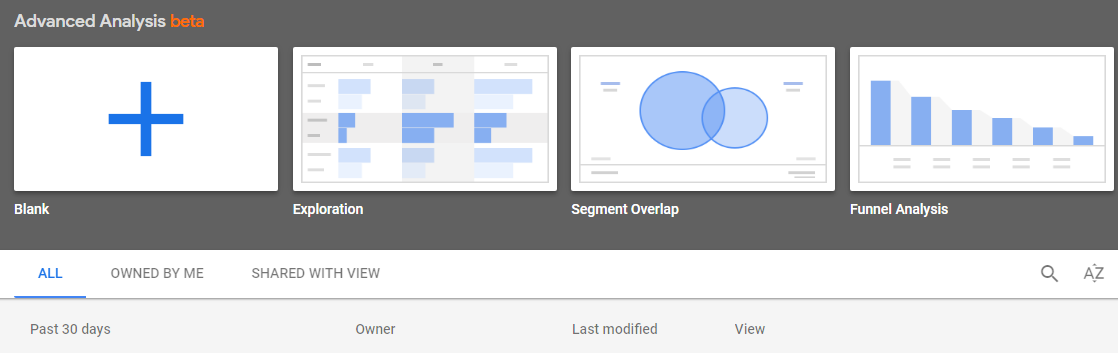
You can create a blank template at the top, or if you know what report you want to build out already, you can select that here as well. Since this is our first time in Advanced Analysis, let’s start by creating a Blank report, so that we can explore each feature in the Advanced Analysis toolbox.
After creating a blank template, you’ll default to the Exploration Technique (more on this below). Before diving into how each Technique works, let’s go through the basics of the navigation on this page.
- Analysis Name: Here’s where you can name your report for you or team members to access later
- Date Range: Select the date range of your report using this filter. Note that the date filter you select is persistent across the tabs you create in your report (#4 on the screenshot)
- Technique: Select the Technique that you’d like to use here; Either Explore, Funnel Visualization, and Segment Overlap.
- Create Tab: Create new tabs here to create different views for your data. Note that in addition to date ranges being shared across tabs, the Segments, Dimensions, and Metrics that you pull into the Variables Pane are shared as well.
- Segments: Pull in System, Custom, as well as Shared Segments from this pane. Note that you can only have a maximum of 10 segments across every tab of your report, and changing segments will break visualizations that are using them in another Tab. You can also create segments in Advanced Analysis! (More on that later)
Now that we’ve got the navigation down, let’s dive into what each Technique is doing and how it will be valuable to you and your business.
Exploration
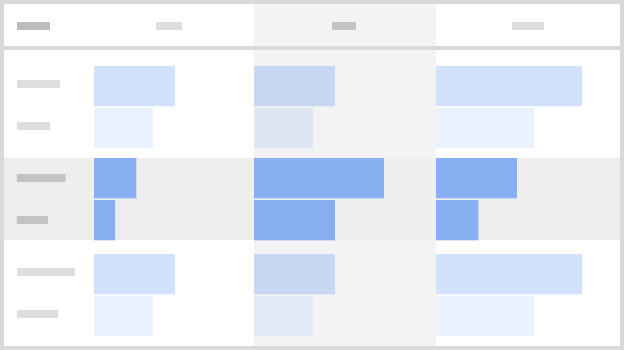
The Exploration tool allows you to easily drag and drop multiple segments, dimensions, and metrics to quickly create reports on the fly. Think of this as a more robust Pivot Table like you’d use in Sheets or Excel.
Dragging variables into the canvas populates the visualization instantly, allowing you to explore your data in a single view - helping you to tweak and test as you work. You can select multiple ways to break out your data via the Visualization selector, located right below the Technique selector.
Now that we’ve got the basics of the report down, let’s try to use the tool to solve specific business objective. Say for example you wanted to compare the Landing Pages of Single-Session Users and Multi-Session Users to identify the habits of your repeat customers. You can easily pull in these default segments and slice them with dimensions and metrics to uncover key insights on user behavior, channel performance, and much much more.
Note that Segments created in GA are populated in the variables pane, allowing you to control what subsection of users you want to zoom in on from types of segments you’ve already created outside the interface.
Funnel Analysis
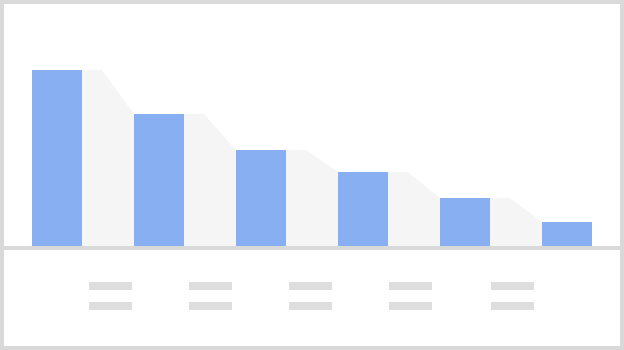
The Funnel Analysis tool allows you to better understand how users are progressing through goals on your site. With the current Custom Funnels in GA360, you can add up to 5 steps - with Advanced Analytics you can add up to 10.
These extra steps with the added ability to add multiple segments and dimension breakdowns allow greater depth of analysis of the funnel process.
The provided funnel visualization report is a simple technique to segment your users. You can create a funnel in this tool that will let you analyze completions and abandonment throughout the process.
Segment Overlap
The third and final technique in Advanced Analytics, is Segment Overlap. Segment Overlap allows you to see how the advanced segments you’ve created in GA360 intersect with one another.
Note that you can only import three segments in the pane for comparison, but you can drag in up to 10 metrics and 5 breakdown dimensions.
Say for example we wanted to see users who returned to the site via Direct Traffic, and completed a conversion. We can simply drag in the Returning Users, Direct Traffic, and Sessions with Conversions segments to create this view.
Creating Segments in Advanced Analysis
In the same way that you can create segments in the broader GA interface and bring them into Advanced Analysis, you can do the reverse and create segments to apply outside of Advanced Analysis.
Say for example we wanted to segment the users from the previous example - you can easily right click the cross section of all three of these segments, and create a new segment! After saving this segment to your Segments Pane on the left, you have to right click that segment and “Publish” it so you can use in other GA reports. You can also create segments in the other techniques - simply right click in the canvas on the data that you want to create a segment on, and hit create segment.
In addition to creating segments, you can also easily create Audiences from these overlapping segments. This makes your data instantly actionable all within just a few clicks.
Do you have GA 360? Will you use Actionable Analysis to interact with your data in a drag and drop, intuitive way? Let us know what you think of the beta version of the tool in the comments below, and keep reading our content for other ways to gain value from your Google Analytics 360 implementation.