Your SEO Team Is Building AI Visibility. Your Paid Media Team Should Be Too.
Your SEO team is already measuring brand visibility in AI search.
.png)
6 Ways AI Can Improve Your User Research (& 3 Things to Watch Out For!)
This blog was originally published on February 12, 2025 and was updated on June 1, 2026. UX research is powerful—but slow. Finding participants, analyzing respo…
-1.png)
From Launchpad to Seer: Meet the Interns Behind Our AI Optimization Academy
Earlier this spring, we launched our AI Optimization Academy in partnership with Launchpad, bringing three Philadelphia interns into Seer to do real GEO researc…
.png)
What It Takes To Rank In Google's AI Overviews in 2026 Isn't What You Think
AI Overviews (AIOs) now appear on nearly 65% of question-based searches, which are the same queries informational content is built to win. The citations inside …
The 5 Stages of AI Marketing Maturity (with examples)
I am fascinated by the future. I also am worried about it.

Diagnosing Organic Traffic Decline: 19 Effective Ways | Seer Interactive
Use the ChatGPT powered version in the GPT Store! This post was originally published in 2019, and last updated in May 2026.
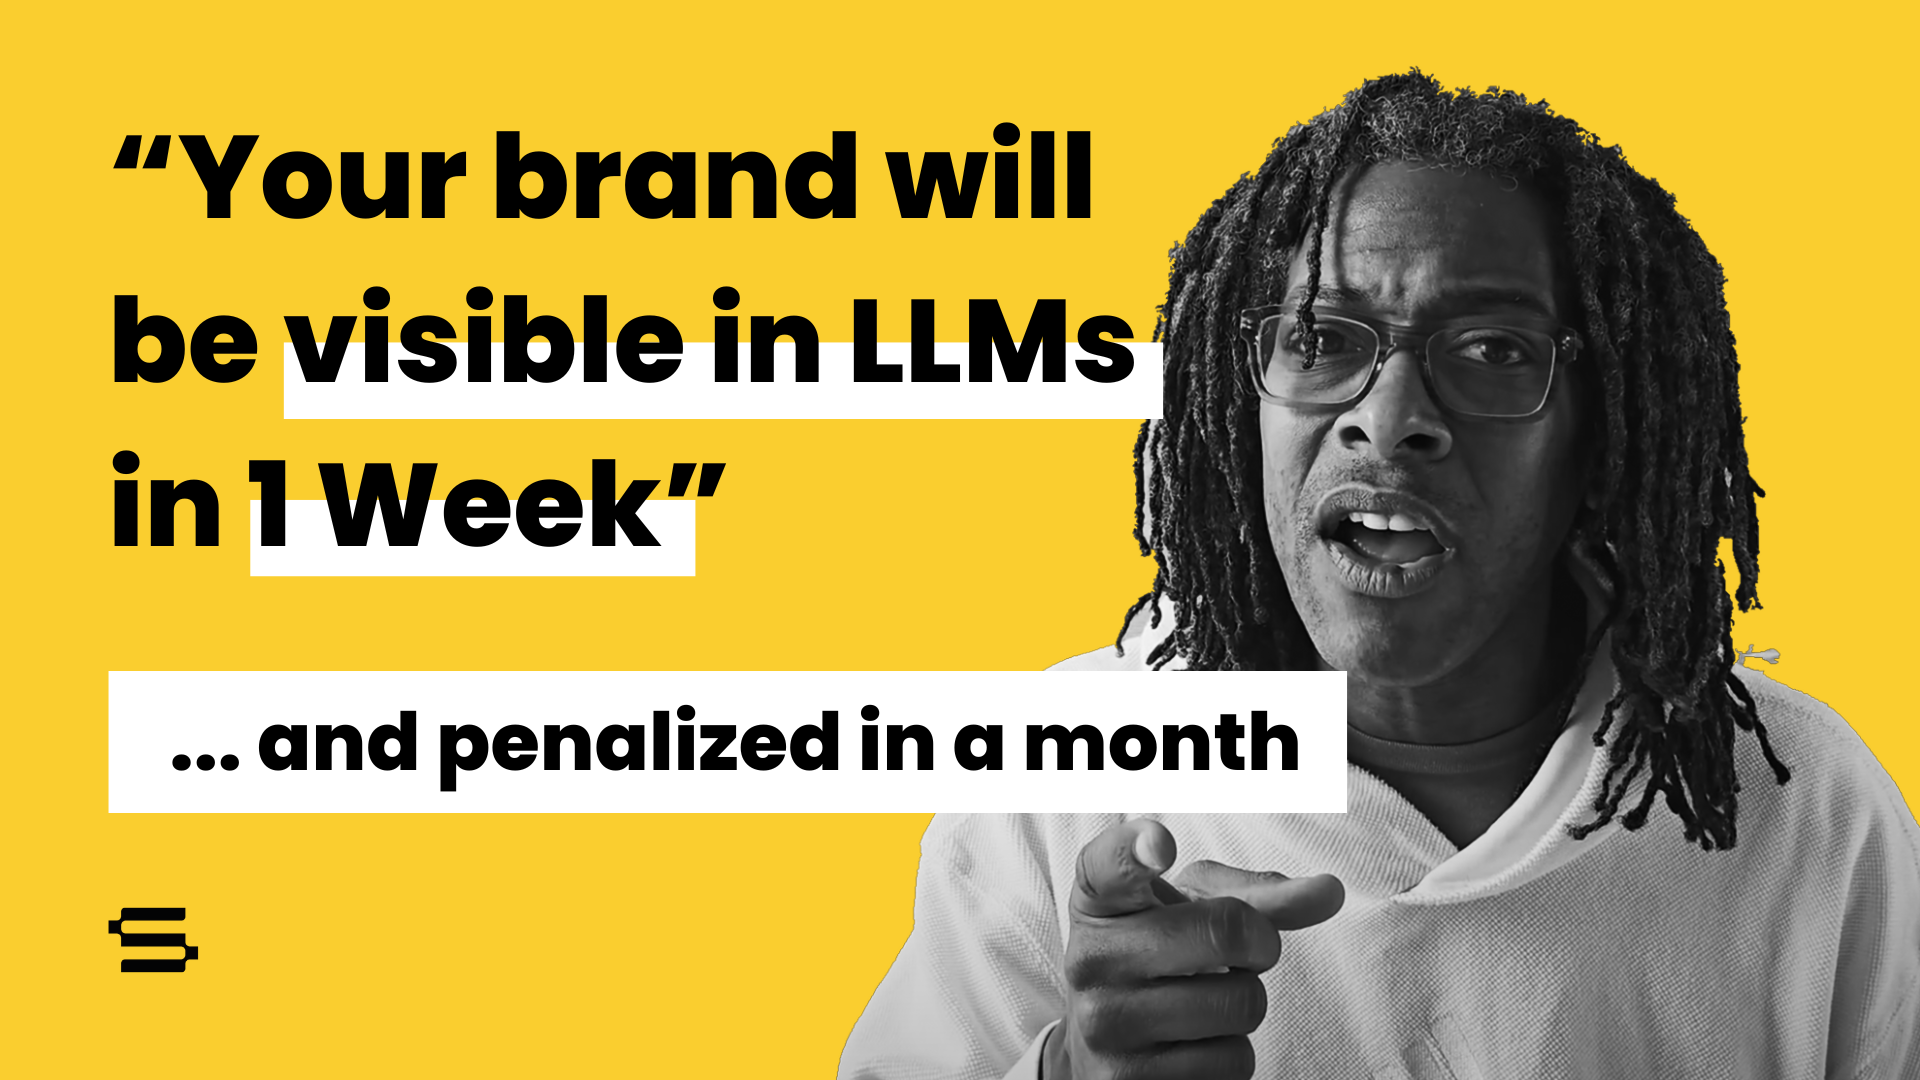
The Problem & The Fix on GEO case studies promising results in 1 week
CMOs and leaders are having boards and CEO’s breathing down their necks, tons of pressure, and when they hear “we can get you AI visibility results in 1 week" f…
.png)
Stop Chasing AI Rankings Before You Fix How LLMs See Your Brand
The counterintuitive truth about AI visibility: Most brands are trying to win elections before voters know their name.
.png)
From UX to AX: Why Replacing Design Thinking With AI Is A Bet Against Your Own Visibility
I graduated with a graphic design degree in 2009, just as the bottom fell out of the industry I thought I was entering.
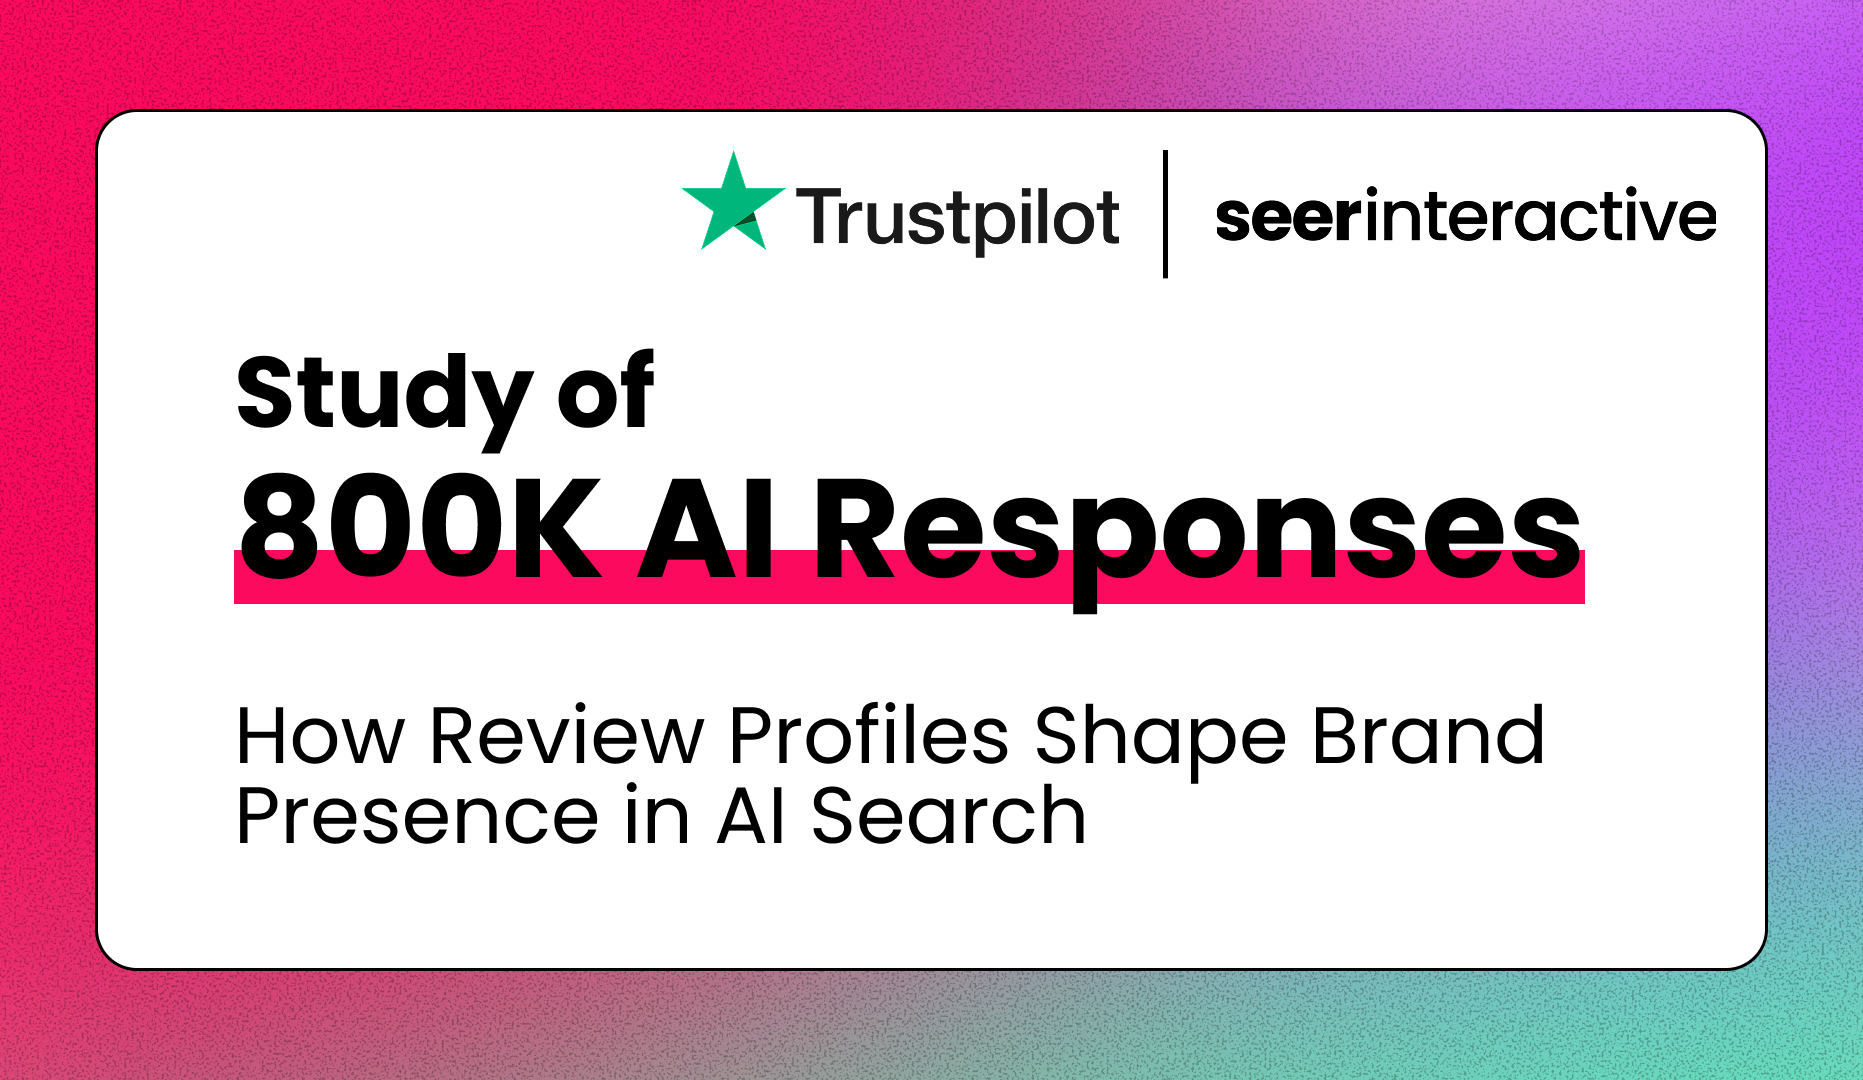
Study of 800K AI Responses: How Review Profiles Shape Brand Presence in AI Search
Does having a brand presence on third-party review sites impact your visibility in AI search?
.png)
Does The Right Buyer Even Know You Exist? Our LinkedIn Restructure That Took High Quality Lead Rate from 32% to 89%
B2B marketers are under more pressure than ever to prove that paid media is working. Budgets are scrutinized, sales teams are skeptical, and the bar for “high q…
.png)
Buying ads on ChatGPT? Why you should check organic reputation first!
Most paid teams are approaching LLM ads the way we approach any new placement: