To say that there are a host of factors impacting your website performance is to state the obvious, but are you currently measuring all the different factors involved?
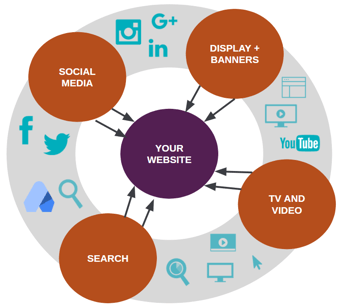
On any given day, both online and offline channels drive traffic to your site. Online traffic via paid search, social media and display are easily measured in the digital age if you have the know how.
In fact, with the measurement tools at our disposal—and an ever evolving Google Analytics suite, including Google Analytics 360 (for which we are a Premium Reseller)—it’s getting easier to analyze the impact of all channels on website traffic. Throw in the use of powerful dataviz tools such as Power BI and Tableau and you’re able to easily see the user journey from start to finish.
However, it’s significantly more difficult to measure the impact of TV advertising on your web traffic in a cost effective and lean way without commissioning a brand study. Have you always wanted to understand the impact of your TV ads on your website performance? Is your holistic analysis slightly incomplete if you’re not factoring in how TV ads drive digital impact? We’ve been there.
Television Attribution Models in GA 360
First, let’s go over the basics of attribution models. An attribution model is a set of rules that assigns conversion credit to channels along the conversion path. The free version of Google Analytics has 7 standard attribution models (to learn more about Google Analytics 360’s Data Driven Attribution model, click here). With digital channels, attribution is significantly easier to establish. For TV, however, and understanding TV ad effectiveness, the task becomes a lot more difficult.
💡 Skip to the example case study for a video walkthrough of results we saw for a client.
How to Measure TV Advertising’s Impact on Website Traffic
Nonetheless, we do have a quick and dirty method for TV attribution so you can gain a broader understanding of how TV impacts your website performance and overall tv advertising effectiveness.
First, you will need to get a hold of your TV ad runtime data. You’ll want to make sure that the data you’re using covers as long a period as feasible and incorporates a high level of spend.
So, for instance, if you run TV campaigns all year long, you’ll want to base your analysis on the time period that has the highest spend (e.g. peak season and where you’re spending the most in a given year on TV ads), so that the impact on site traffic is more readily visible.
If you’re using a period of low spend then the scale may not be there to show an impact on the site.
Here are some data points you’ll want to include in the TV data:
- TV ad run date and time (hour)
- TV ad impressions
- Ad spend (optional)
- Ad creative
- TV ad run show
- TV ad run network
And here’s what you’ll want to include in your website data:
- Date
- Time of day (hour)
- Channel
- Website sessions
- Website conversions
Once you’ve pulled your data, you’ll want to create a custom dimension called date-time, so you have exactly when the ad ran.
We’ll be using the date-time dimension as the connector when joining the data in a visualization software such as Power BI or Tableau, and it’ll allow you to connect TV spend in a given date-hour to sessions and conversions in that given date-hour.
What’s The Catch?
The catch is that the analysis is directional. You’ll be able to see the correlation of TV on website performance, but you won’t be able to pinpoint exactly what percentage of performance TV is responsible for (hey, I said quick and dirty).
For the purpose of this analysis we are comparing traffic and tv ad impressions within a single hour. The limitation here is that a TV ad could be driving site traffic in the next hour or even later in the day for example.
What Can I Get By Measuring TV Ad Effectiveness?
💡 Skip to the example case study for a video walkthrough of results we saw for a client.
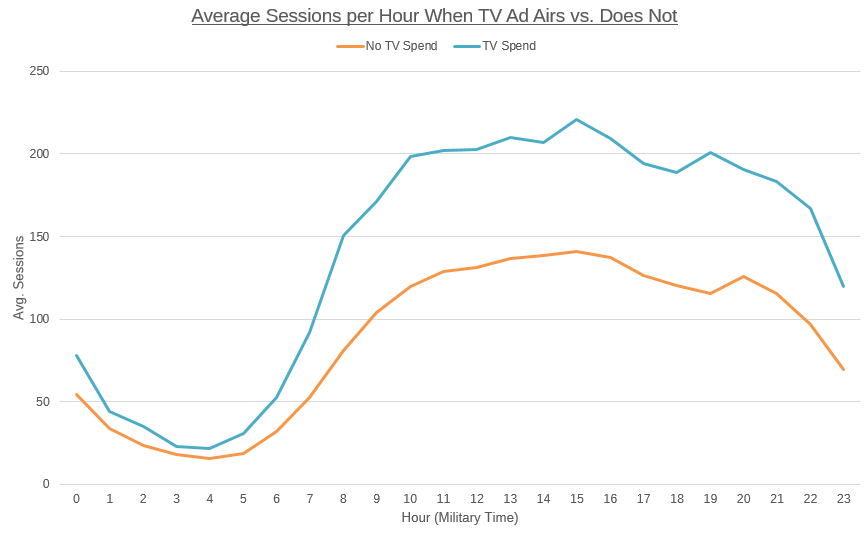
To start with, you can gain an understanding of TV impact by plotting average sessions in an hour that a TV ad airs versus not. In the illustration below, the greatest impact of TV occurs during the hours of 10 AM to 7 PM, and you can drill down to the impact at an extremely granular level, including the exact date and time.
Second, filtering will allow you to see the impact of TV on each channel.
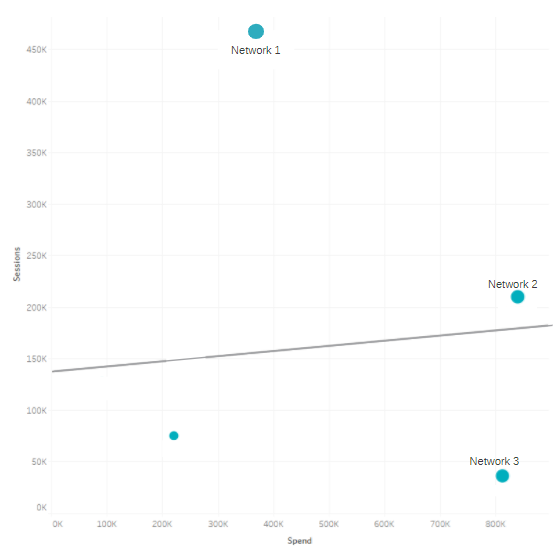
Additionally, by plotting your networks and shows on a scatter plot with sessions and spend on each of the axes can allow you to see which of your networks and shows are correlating with driving higher sessions to the website.
In the below example, you can see that Network 1 has a significantly lower spend than Network 2 but drives higher sessions (and conversions, which is represented in the size of the bubbles). Now this might not tell you that Network 1 definitively drives higher sessions but it will allow you to give Network 1 a bit more weight given its correlations with site performance.
The same can be done for show, creative, etc. to derive general insights as to how TV is impacting your website.
A useful way of isolating traffic coming in from a TV ad is by use of vanity URLs, which allows you to make more definitive conclusions about how TV is impacting the website. For more information on vanity URLs, check out the Seer blog post here.
Example Case Study
We ran this analysis for one of our clients, Trex -- uncovering hidden ROI of TV efforts. Check out the video below for more details:

Questions? Comments? Give our Analytics team a shout. We’d love to walk you through our approach to TV analysis.