

How to Modify the Legend Order in PowerBI
Before you dive into anything too cool in Power BI, it's necessary to have an ideal legend. When using Power BI to organize groups of data, the order of the legend is not always where you’d like it to be, especially when creating custom groups. Luckily, it’s pretty simple to create a custom sort order in Power BI in a few steps.
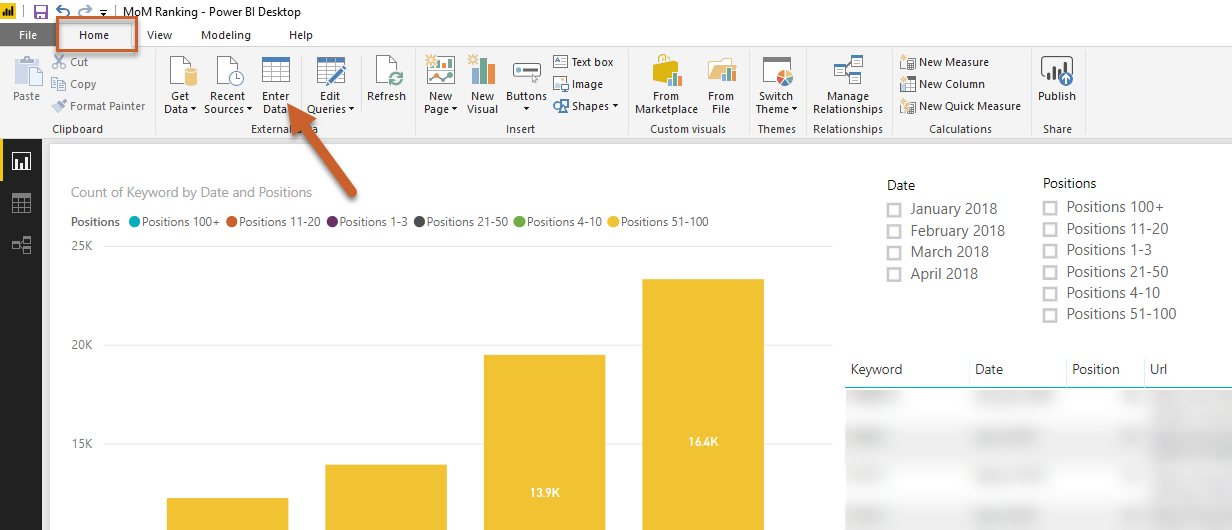
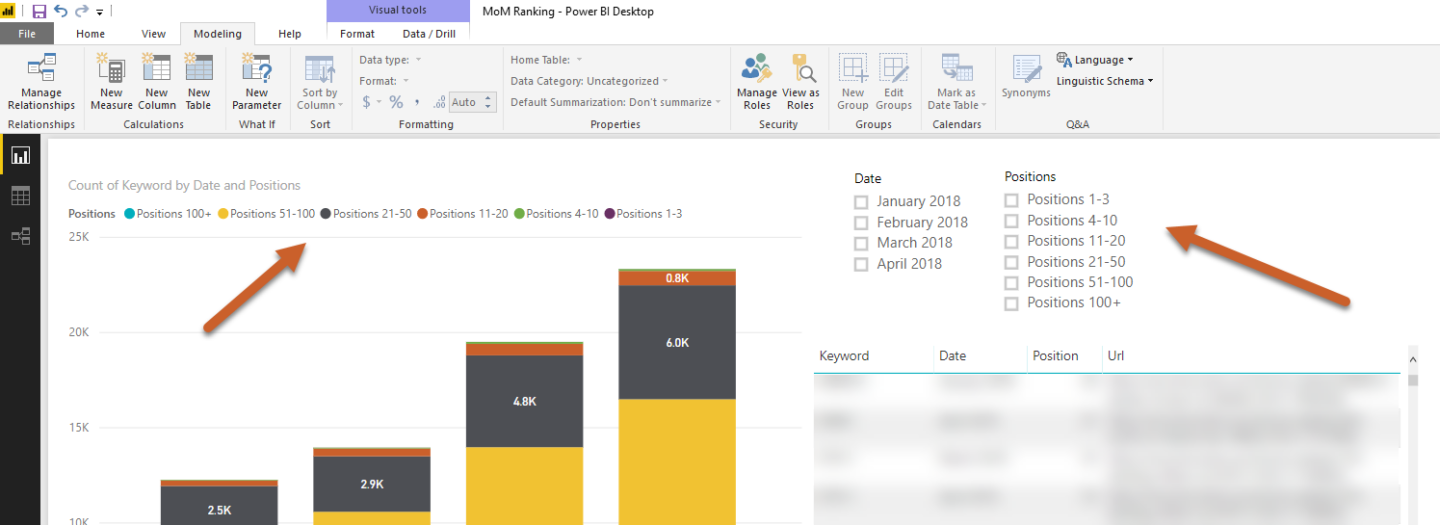
For this example, we’re using a bar chart with MoM keyword rankings grouped by positions. We’ve grouped keyword rankings into the following position groups:
- Positions 1-3
- Positions 4-10
- Positions 11-20
- Positions 21-50
- Positions 51-100
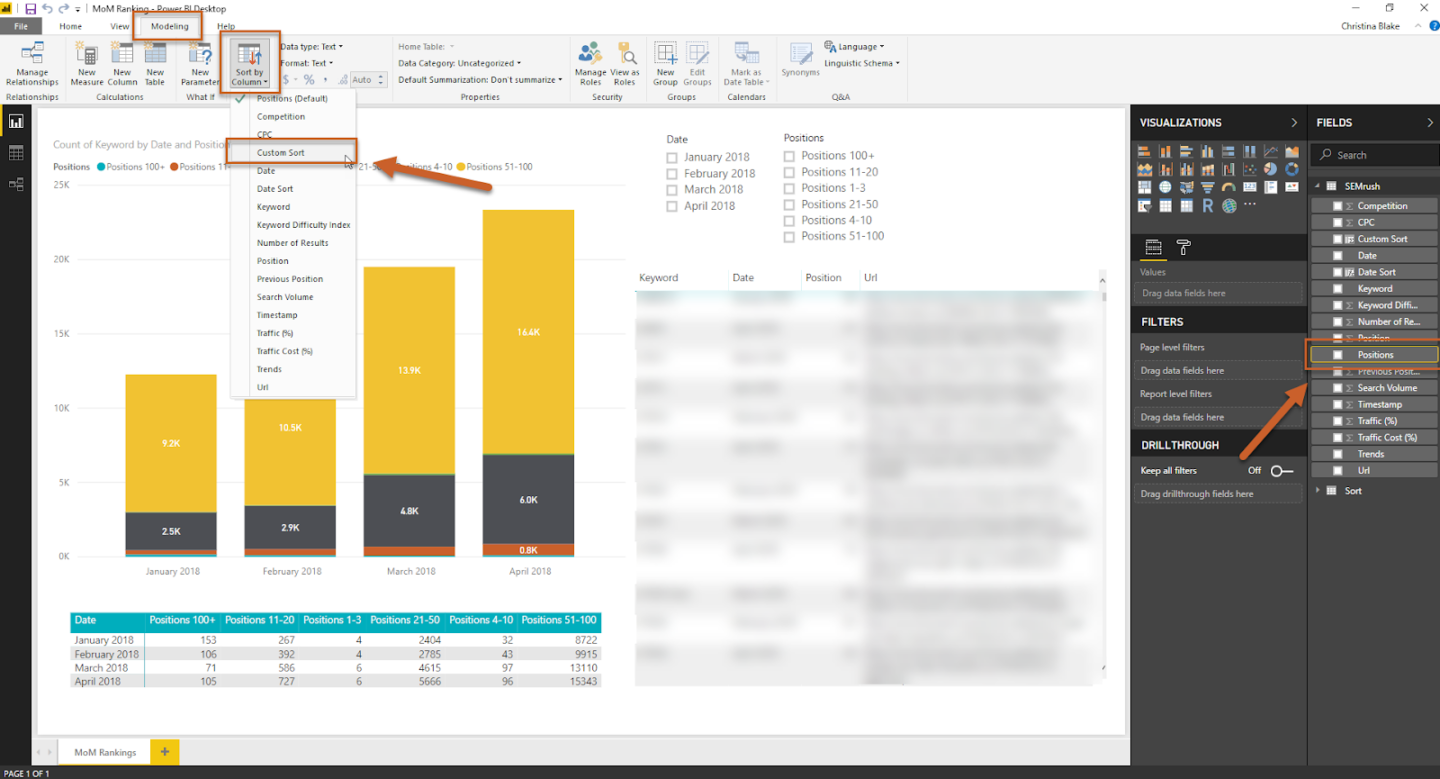
In the example, the positions are out of order—this results in the stacked bar chart showing positions 100+ at the bottom, then 11-20, then 1-3, then 21-50, then 4-10, and finally 51-100 at the top. Not ideal.

Create a new table with your sort order
Create a simple table with two columns by selecting the enter data icon under the home tab.
In one column (example: “Group”), including the groups you want to sort, making sure to enter the groups exactly as written (case-sensitive). In the second column (example: “Order”), add numbers to designate your sort order. For a bar chart, these numbers will be “backwards”, so that 100+ will be at the bottom and 1-3 will be at the top.

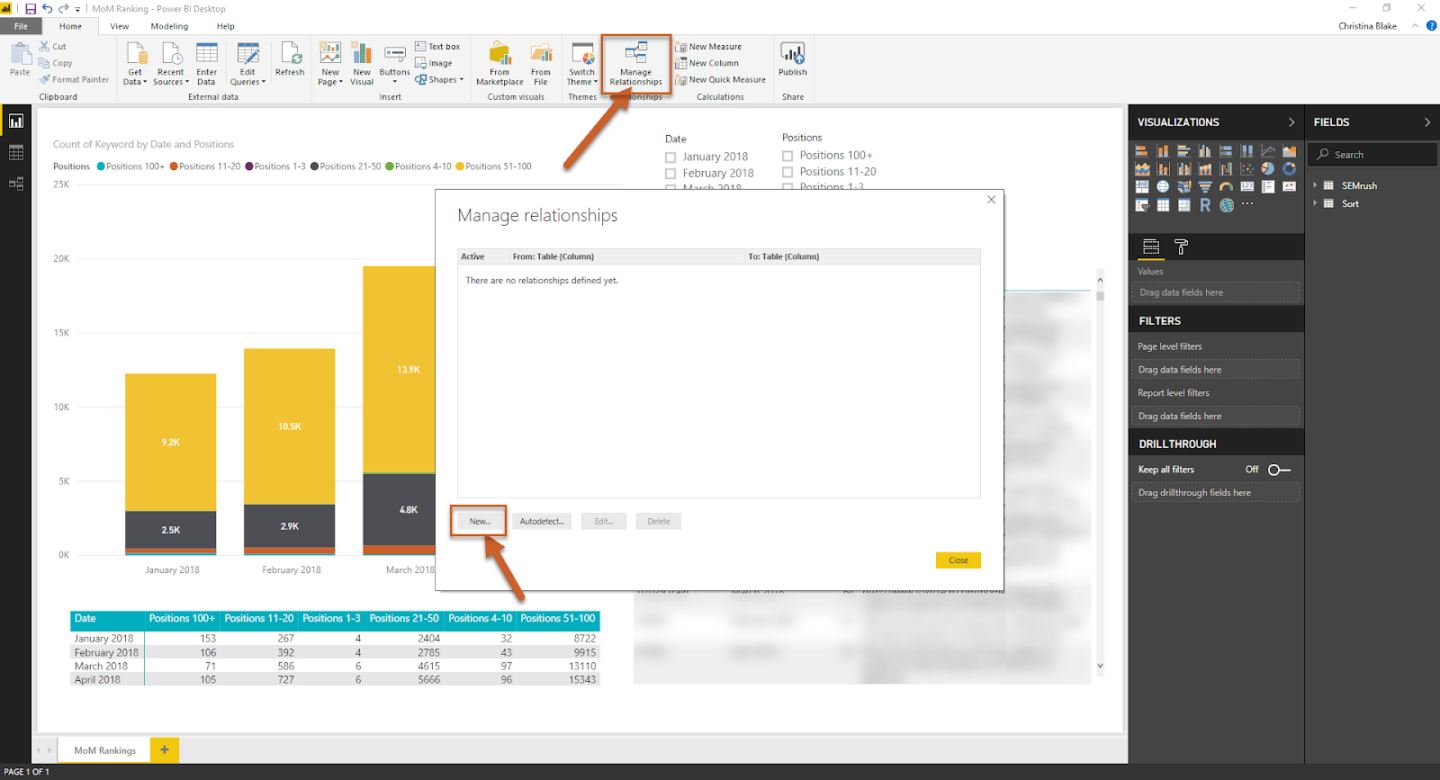
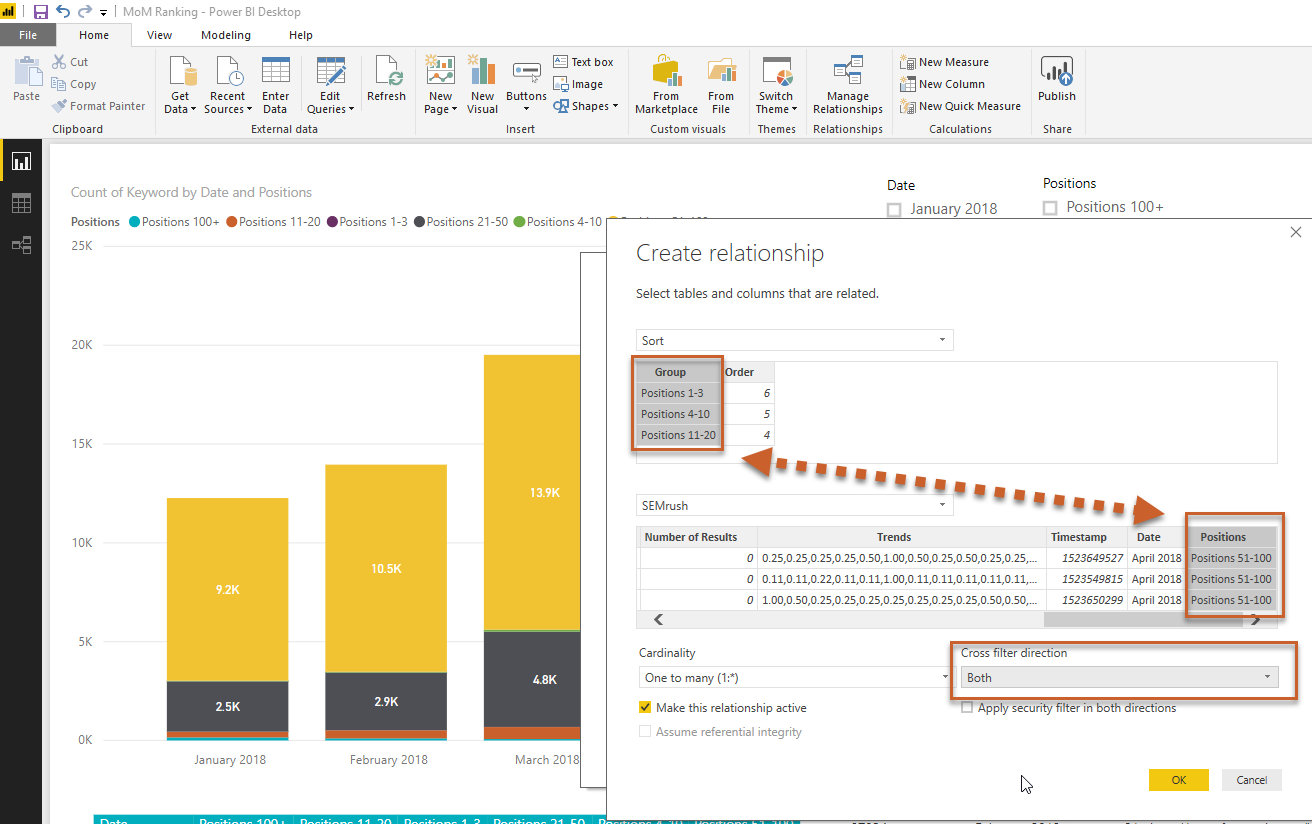
Create a relationship between the new table and your data
Select manage relationships and create a relationship between the new table and the original table.
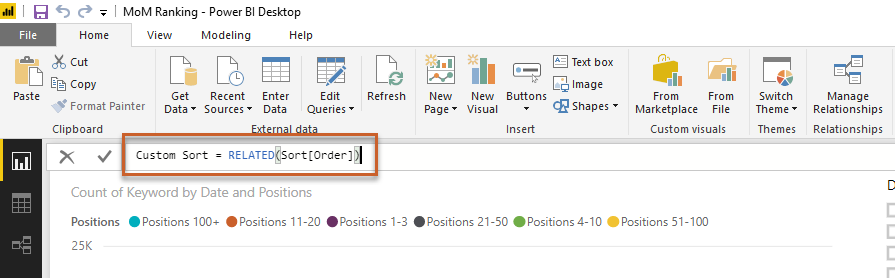
Use the DAX related function to create a sort order
In the original table, create a custom column by right-clicking on the ellipses to the right of the original table and selecting a new column.
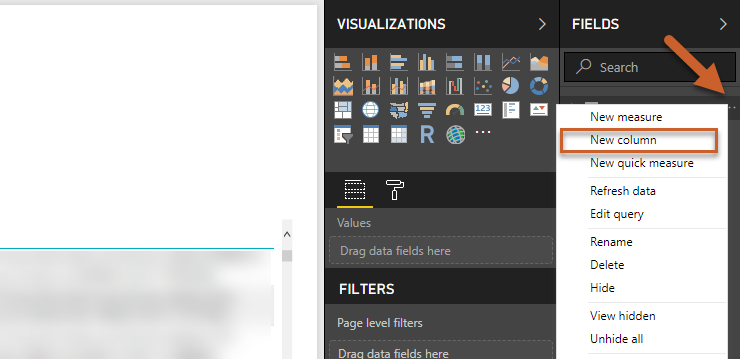
Use the DAX function Custom Column = RELATED(Table[Column]). For this example, the formula should look like “Custom Sort = RELATED(Sort[Order])”.
Sort your column by your custom sort order
Select the column you want to sort with your custom order (for this example, "Positions") and select sort by column under the modeling tab, select the name of your custom column (in this example, "Custom Sort").
You’re done! The bar chart is now organized with highest ranking positions at the top and lowest at the bottom.
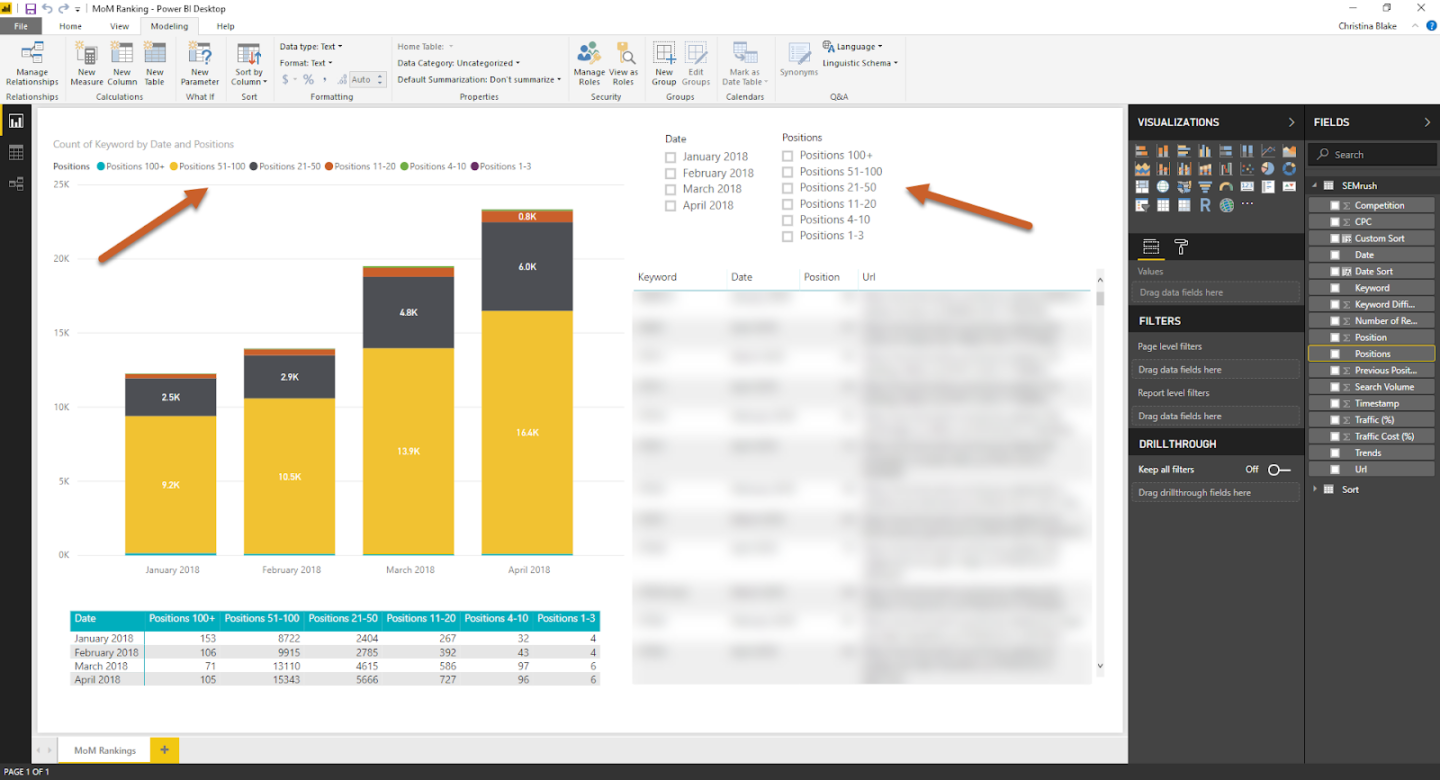
But wait—the slicer is backwards (reading lowest ranking positions at the top and highest at the bottom), which is a little annoying.
Custom sorting charts
To sort the slicer so that highest ranking is that the top and lowest is that the bottom, right click the ellipses at the top right of the table to open more options. At the bottom, select sort by positions to switch the A-Z sort from Z-A.
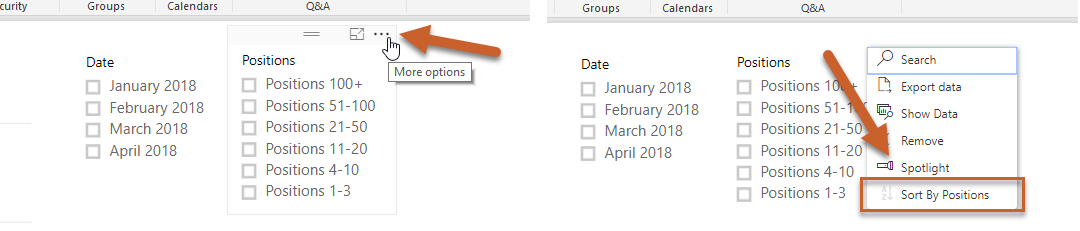
Good to go!
Ready to take a stab at a similar analysis? Be sure to reach out if you need any help! Contact us here. And be sure to check out more helpful Power BI info on our blog, like how to join many to many with a bridge table.
Subscribe for more posts like this in your inbox: