
The Importance of Site Search Data
Site Search is one of the most crucial aspects of a positive e-commerce user experience. According to Econsultancy, up to 30% of visitors will use the Site Search box, and those visitors convert at a 1.8x higher rate than visitors who don’t use Site Search.
But Site Search isn’t just about user experience - it provides indispensable data to website owners and marketers about user intent. We can view the pages that a visitor viewed and make reasonable assumptions about what they’re looking for, but Site Search data can tell us exactly why they viewed those pages, and exactly what they were looking for, in their own words!
Analyzing Site Search Data
For the sake of this analysis, we’ll be primarily focused on the following:
- Search Term: These are the actual words and phrases that users are typing into the search box on your site
- Start Page: These are the pages from which your users are searching - the URLs on which they are located when they type their Search Term into the box
It’s easy to find Site Search data in Google Analytics. Just navigate to Behavior > Site Search > Search Terms, and then click on Ecommerce to view the terms that your users are searching for, the number of searches, and the number of transactions and total revenue per term:
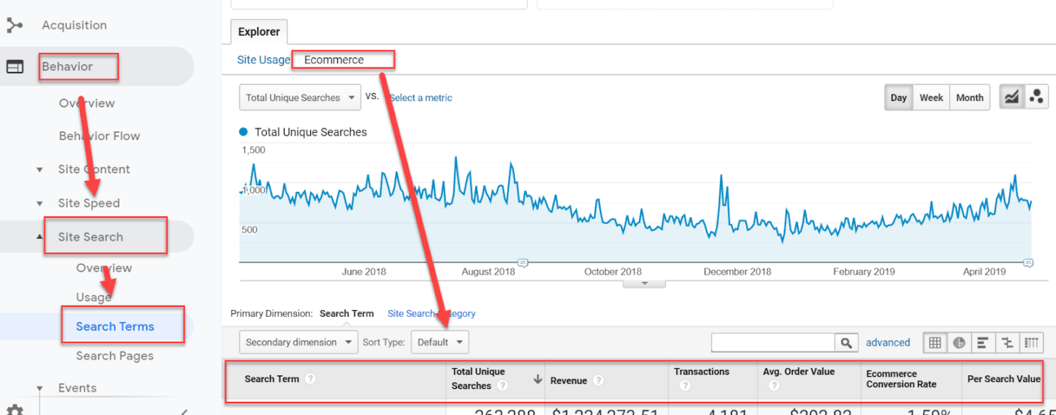
From there, you can see a list of all of the Search Terms your users are typing into the search box:
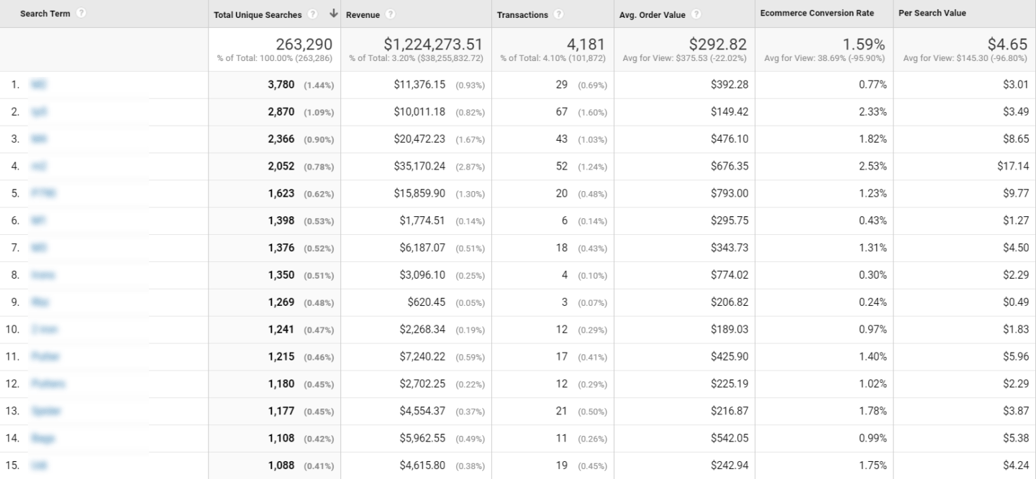
This is useful for identify popular products, but let’s go a step further to learn more about what users are searching for. If we click on the Start Pages report and add Search Term as a secondary dimension, we can see what users are searching for based on what page they’re on.
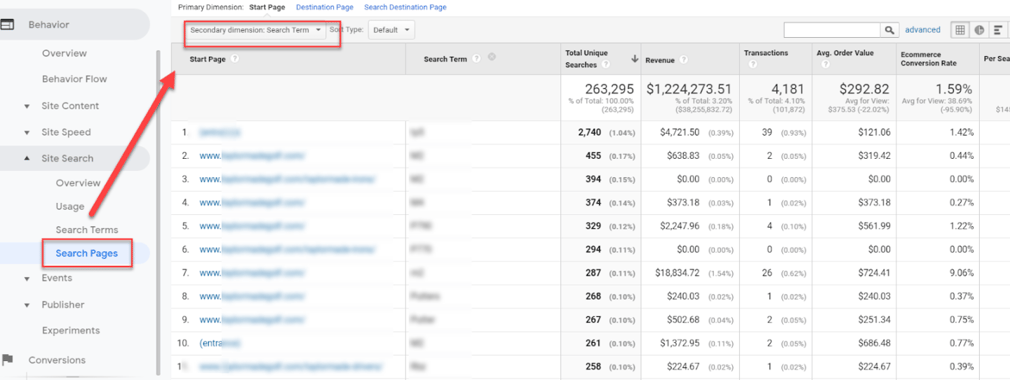
This report provides us with a list of URLs, Search Terms, and e-commerce metrics, but combing through rows of data isn’t the most efficient way to do analysis. Instead, we can use Power BI to create visualizations that will help us to easily review data and identify opportunities for optimization
Using Power BI to Visualize Opportunities
This simple dashboard takes just a few minutes to create and will allow us to easily find optimization opportunities
Preparing Your Data
- Download the Start Pages report from Google Analytics as a .csv. Be sure that you have Search Term selected as your secondary dimension
- Seer recommends downloading at least six months worth of data, or, if you sell a lot of seasonal items, a full year
- Load the .csv into Power BI, and clean your data.
- To clean your Start Pages URL data, see Seer’s guide to data cleaning & preparation for URLs to learn more about handling protocol, parameters, trailing slashes and more
Creating Your Visualizations
Start Page & Search Term Matrix
- Visualization Type: Matrix
- Rows: Start Page, Search Term
- Values: Total Unique Searches, Transactions, Revenue
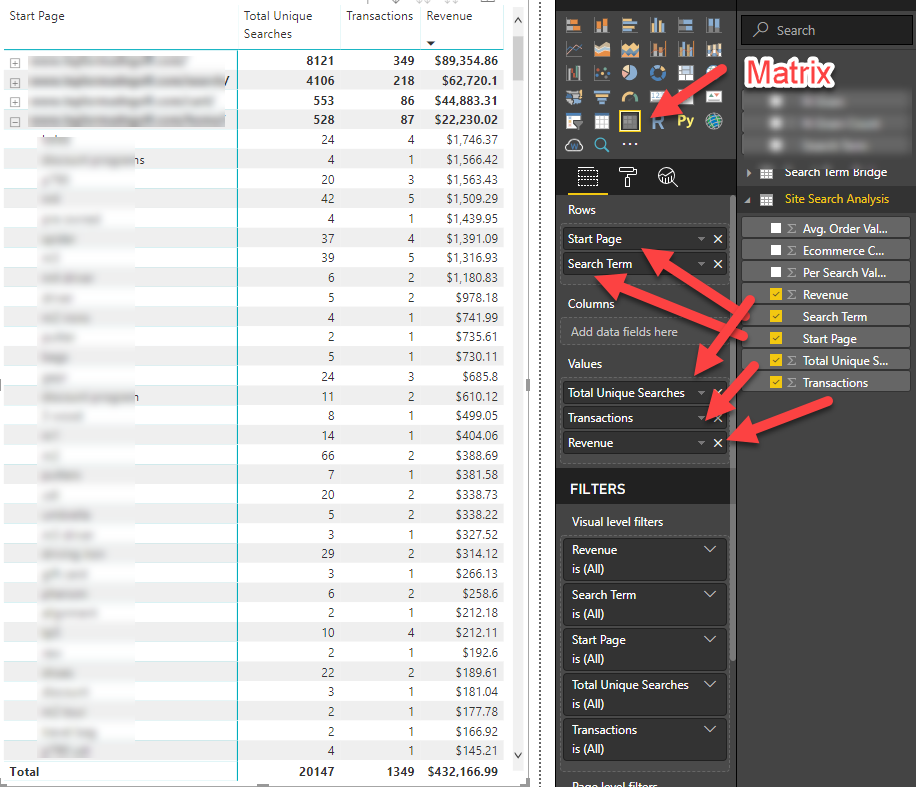
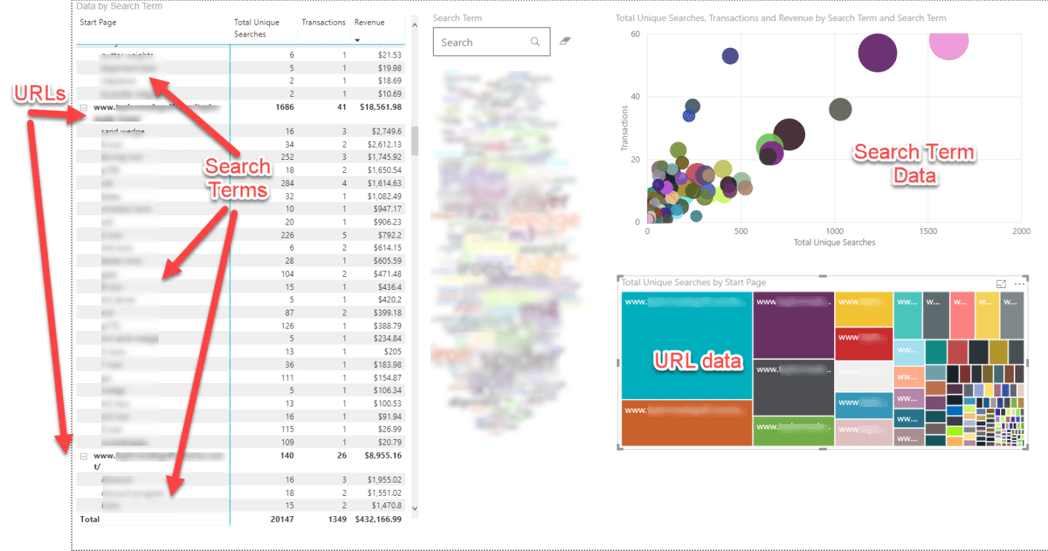
Analysis: This visualization is a matrix that contains all of your data. As you drill down through the other visualizations, the matrix will update and filter to show you data specific to each Search Term or Start Page.
Start Page & Search Term Matrix
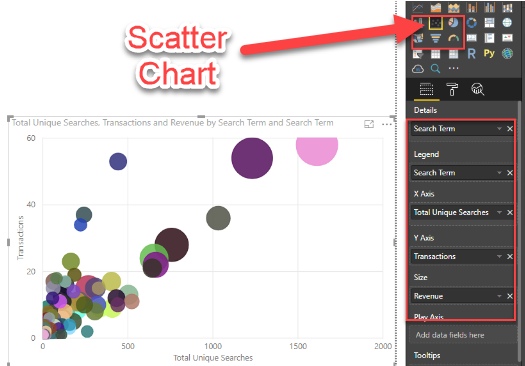
This visualization takes a look at all of your site’s Search Terms, organized by the number of searches, transactions, and revenue.
- Visualization Type: Scatter Chart
- Details: Search Term
- Legend: Search Term
- X Axis: Total Unique Searches
- Y Axis: Transactions
- Bubble Size: Revenue
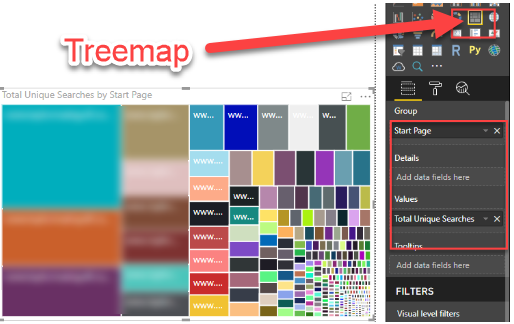
Start Page TreeMap
This visualization shows us Start Pages ranked by the number of Total Unique Searches
- Visualization Type: TreeMap
- Values: Total Unique Searches
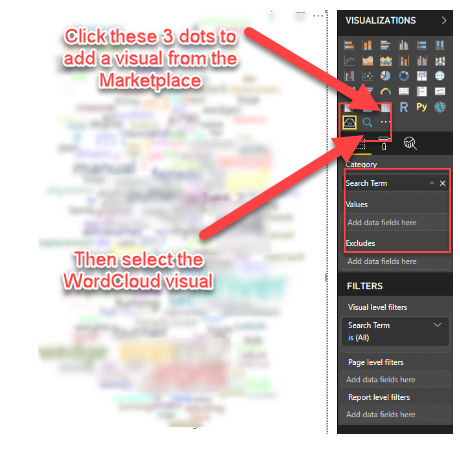
Search Term Wordcloud
This visualization allows us to easily see the most common Search Terms that users are searching on each Start Page.
- Visualization Type: Wordcloud
- Note: You’ll need to import this visual from the Power BI marketplace
- Values: Search Term
And now you’ve got your dashboard ready to go!

How to Analyze the Data
Please note: For this analysis, I looked at an E-commerce brand that sells recreational equipment. Since we can’t share their data publicly, we’ve mocked up a dummy site with a similar business model and product. All of the numerical data is real, but the site, Start Pages, and Search Terms have been replaced with fictional data.
Analyze by Search Terms:
Click through your scatter chart to identify Search Terms that are profitable. Remember, Search Terms that are high on the Y axis have brought in a lot of conversions, and Search Terms with large bubble size have brought in high revenue
View the Start Pages for each Search Term to identify from where users are searching for these products.
Find opportunities. When a site visitor uses a search box, it’s usually because what they’re looking for isn’t right in front of them. So if we can use data to make associations between what a user wants and where they are, we can make website updates to improve the user experience.
A Real-Life Example of a Search Term Opportunity:
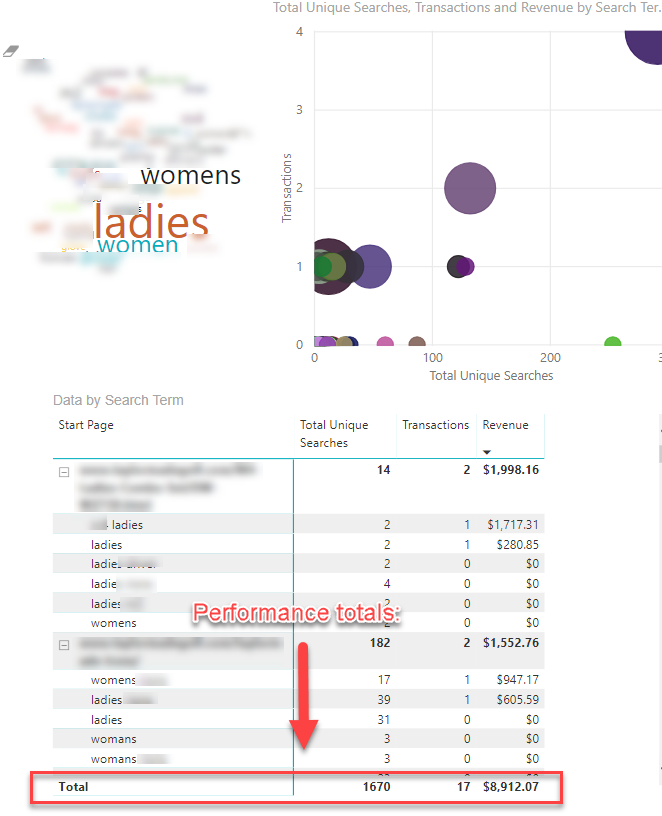
Analysis: As I clicked through the scatter chart, I saw that there was a good amount of Search Terms containing “ladies” or “womens.” There were over 1,600 searches for these terms, showing that users are searching for gender-specific equipment for women.These searches led to 17 transactions totaling almost $9k in revenue:
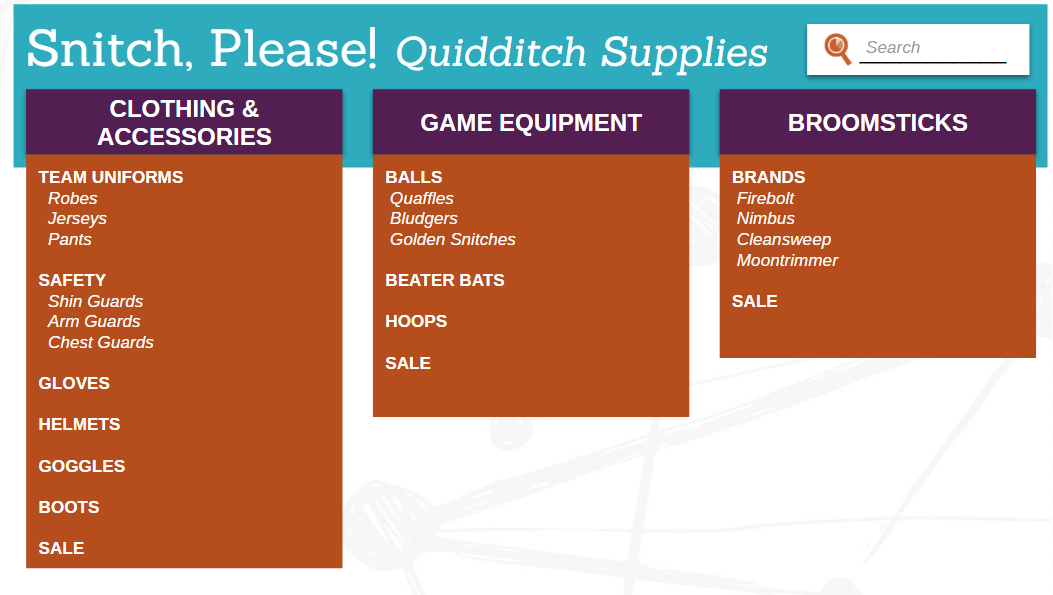
Digging in further, I saw that 25% of the searches were done directly from the home page. But when I viewed the site home page, there was no mention of women’s or ladies’ equipment anywhere on the page itself, or on the top navigation:
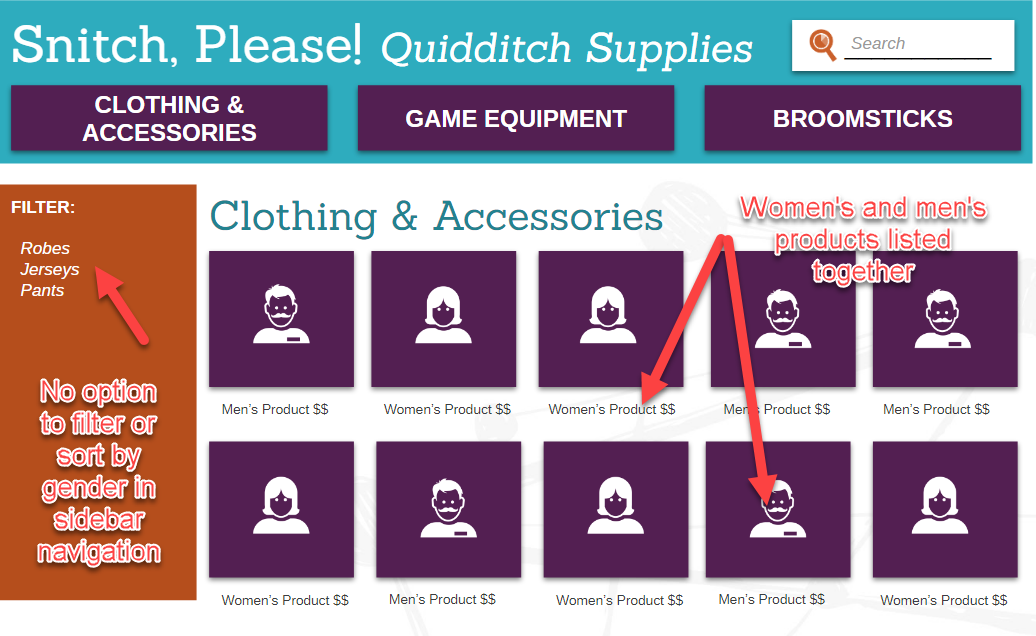
Additionally, over 100 of these searches came from the Clothing & Accessories category page. I clicked through to the page to see that all gendered products were listed together. There was no specific mention of gendered products anywhere on the page except on the product listings themselves. There was no way to sort or filter by gender:
What this means: Users who are browsing for women's’ products on the home page and category page were forced to do a site search because their wanted products had no presence on those pages.
Opportunities for Optimization:
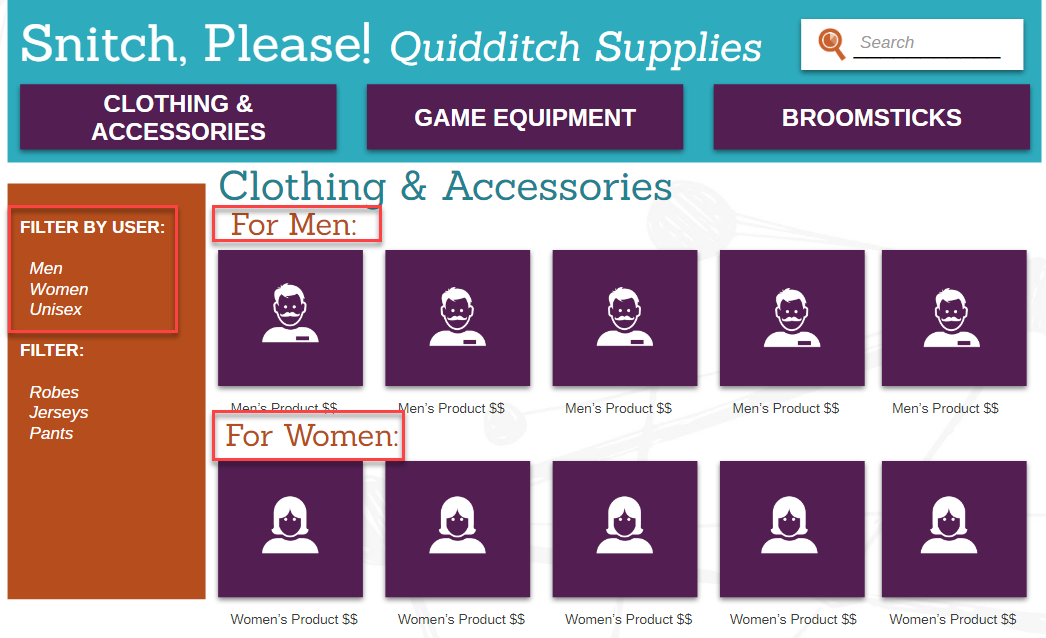
- Promote women’s products on the home page
- Add a link to both men’s and women’s products in the global navigation:
- Add the option to filter by gender on the category page, break out products by gender on the category page, or create new pages for gender-specific products:
Analyze by Start Page:
Click through your treemap to identify Search Pages that have a high number of total searches. Your home page will most likely have the highest number of searches, so you can look there to find popular products. But you may find more specific insights if you look at category pages with lots of searches.
View the Start Pages for each Search Term to identify where users are searching for these products.
A Real-Life Example of a Start Page Opportunity:
Analysis: When I drilled down to look at the accessories page, I saw that 4 of the 6 Search Terms that lead to a purchase from this page were related to rain:
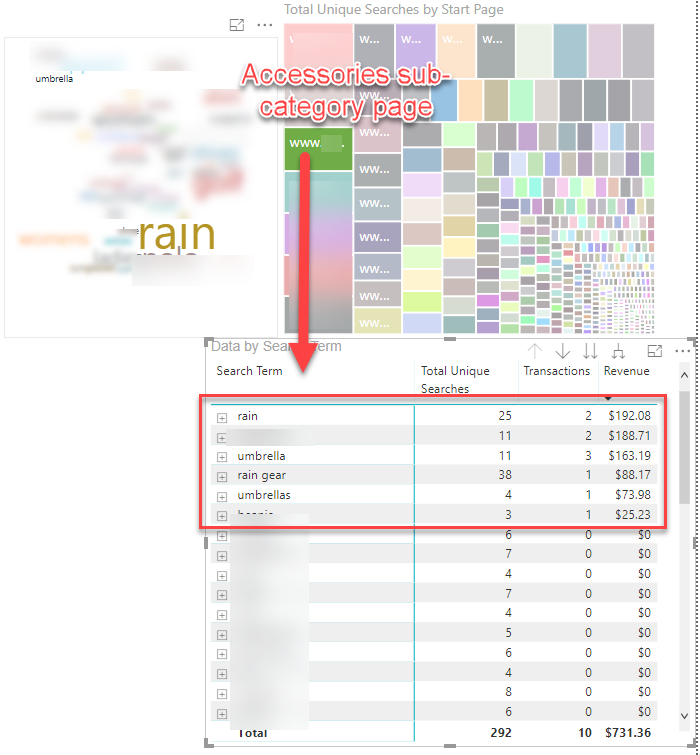
But there’s no mention of rain gear on the accessories page or in the navigation:
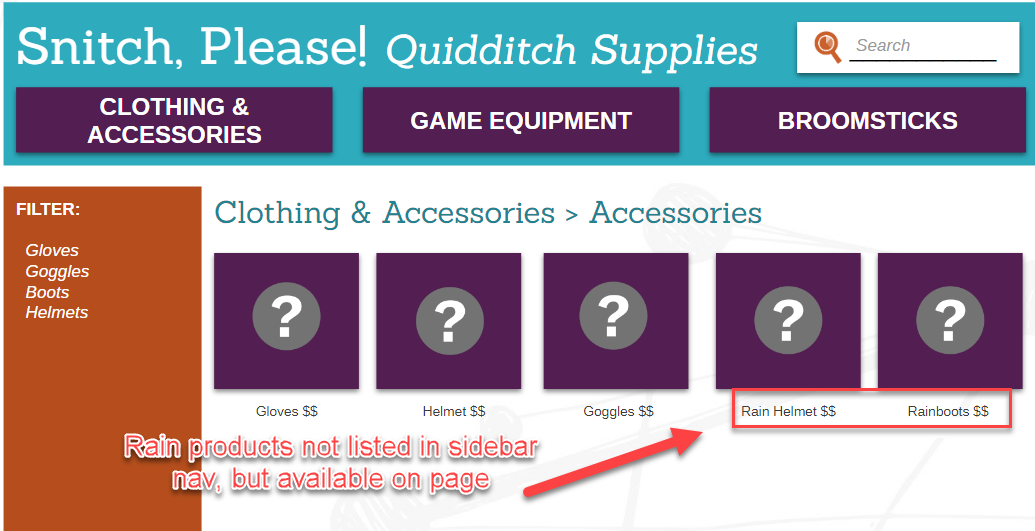
What this means: Users who are browsing for raingear on the sub-category page were forced to do a site search because the products they were browsing for weren’t easily findable on the page.
Opportunity for Optimization:
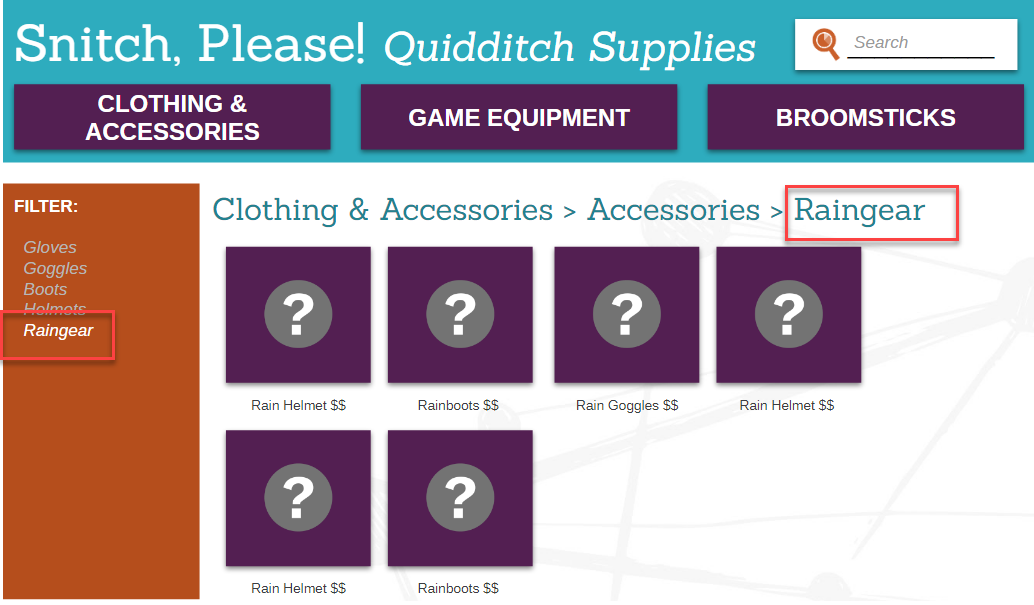
- Add raingear as a category filter in the sidebar navigation to drill down to rain-related products:
Keep on Digging
Spend an hour or so rooting through the data, and you’ll be sure to find additional content and UX opportunities based directly on user intent.
When you feel like you’ve got this down pat and looking for a new challenge, here are a few more things to try:
- Add usage data like Search Refinements, Time After Search, and Search Depth to your dashboard in order to learn more about your users and how they interact with your e-commerce site.
- Pull usage data for users who did and didn’t use Site Search in order to compare your users’ journeys to find what they’re seeking.
Are you interested in learning more about using Power BI to identify marketing opportunities?
Check out our Seer Lab A Guide to Power BI: Big Data for Digital Marketers and sign up for the Seer newsletter today!