As one of the newest members of the SEER PPC team, I was immediately thrown into becoming an Excel Ninja, as our fellow colleagues call us. I quickly learned some of the bells and whistles that Excel has to offer and I am honestly quite disappointed that I hadn't previously learned about pivot tables and vlookups.
Recently, I discovered yet another huge timesaver: the ability to link data from Excel to PowerPoint. This feature is perfect for PowerPoint presentations that are in need of constant updates. As we always love to share our favorite lifesaving formulas, tips and tricks, I wanted to share a quick how-to with you. Follow this simple step by step process to link your Excel data to PowerPoint.
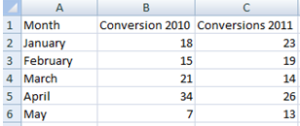
Step 1: Create your table of data in Excel as you usually would. Make sure you save the workbook before linking it to the PowerPoint file.
Quick Tip: If you are sharing the PowerPoint with people who may not have the Excel file but might need to update the data, make sure you provide them with the most up-to-date Excel file on their device saved as the same file name as the original file. You may want to consider using the Microsoft Office "Save & Send" feature or online collaboration tools such as box or Dropbox.
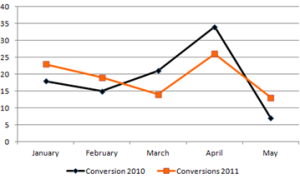
Step 2: Insert a chart to portray your data and adjust the appearance of the Excel chart.
Quick Tip: If you have multiple Excel charts that you wish to link to your PowerPoint, make sure they are all in the same Excel file (they may be on separate tabs within the same workbook).
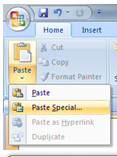
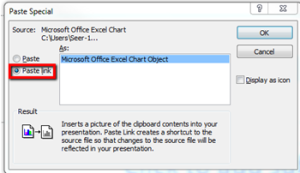
Step 3: Once you're satisfied with your Excel chart, copy and paste special it to the corresponding PowerPoint slide. The "Paste Special, Paste Link" paste option will update the chart every time the presentation is opened to reflect the current data in the Excel file.
Quick Tip: Use the keyboard shortcut Ctrl + Alt + V for Paste Special Options when pasting charts into PowerPoint. The keyboard shortcut Ctrl + V will simply paste the chart into the PowerPoint Slide without linking it to the source file.
Step 4: Your charts are now linked between Excel and PowerPoint! Double-clicking on a chart in PowerPoint will open the Excel file where you can edit the data. Any changes you make in Excel will be reflected in both the Excel and PowerPoint charts.
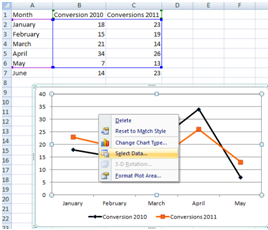
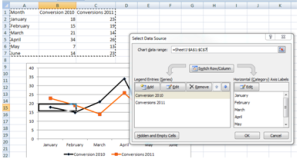
Quick Tip: If you are adding rows/columns, you will have to right click on the corresponding chart in the Excel file and click "Select Data" to select the chart data range. The updated data source should then be automatically applied to both the Excel and PowerPoint charts.
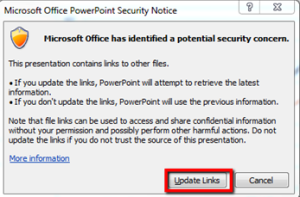
Step 5: Each time you open a PowerPoint file that is link to a Microsoft Office product, you will be prompted to update the links in the PowerPoint file. Simply click on the "Update Links" button; this process may take a few minutes depending on the number of charts that are linked. If the linked file is not available, click "Cancel;" the PowerPoint will still work and the data will be updated once the linked Excel file is available.
Quick Tip: Before sending the PowerPoint presentation to clients (who will not be receiving the source file), you may want to consider breaking the link between Excel and PowerPoint. This can be done in PowerPoint from the Home Button > Prepare > Edit Links to File. Individually select each file you wish to unlink and click "Break Link." Consider saving the unlinked file with a different file name so you can still access the linked PowerPoint for internal changes and updates. Another alternative solution is to PDF the presentation before sending it out.
Now that you know the simple five step process of linking data from Excel to PowerPoint, check out Morgan's blog to learn more lifesaving tricks and be sure to share your Excel lifesavers with us!